Fundamentally Speaking
East-West Soil Moisture Divide
While there was a small improvement in the good to excellent ratings of 2% in last week's (04/11/22) U.S. winter wheat condition report in general, they are still abysmal and already one of the lowest rated crops in history next to 2018 and then further back to 1996.
In a prior blog we noted that it is often said that wheat has ten lives, but this year's crop has used quite a few already so it is unknown how much improvement can be seen.
Yields right now are destined to come in well below trend as forecasts going forward are unfortunately bereft of any meaningful precipitation so we will see.
A lot of attention has been focused on the hard red winter wheat crop given the poor conditions in the Southern and Central Plains where that variety is grown as soft red winter wheat seeded in areas of the Delta and Midwest is faring much better early in the season.
States under the gun include Kansas, Oklahoma and Texas where their combined percent of winter wheat in either poor or very poor conditions is respectively 32%, 33% and an incredible 79% in TX.
There are however a number of other states, especially in the Pacific Northwest and Intermountain Range area, where more of the white winter wheat is produced that are also laboring with very dry soil conditions.
P[L1] D[0x0] M[300x250] OOP[F] ADUNIT[] T[]
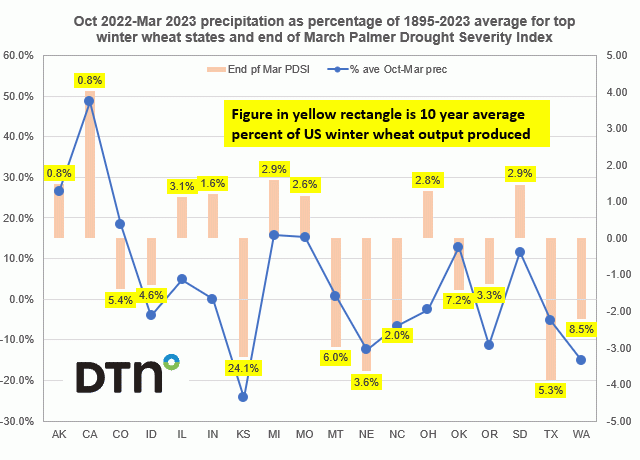
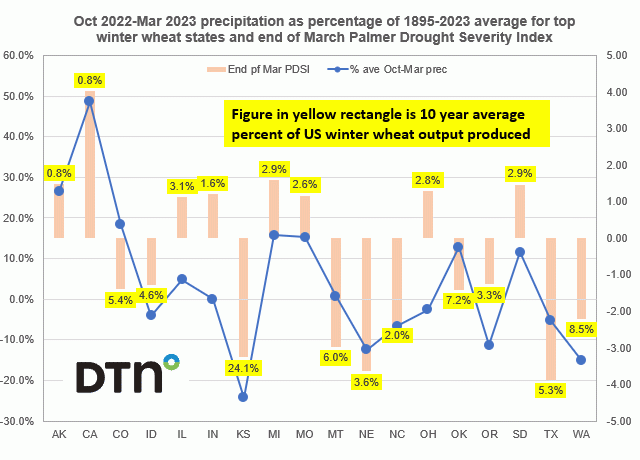
Along these lines, this graphic shows the end of March Palmer Drought Severity Index (PDSI) for the top 18 winter wheat states and U.S. on the left-hand axis.
Where the March 2022 PDSI reading ranks from the period 1960 to 2022 is plotted on the right-hand axis with 1 being the driest or most drought afflicted since 1960 and 63 being the wettest.
For reference, the PDSI is the monthly value that is generated indicating the severity of a wet or dry spell.
The index generally ranges from -6 to +6, with negative values denoting dry spells and positive values indicating wet spells.
PDSI values 0 to -.5 =normal; -0.5 to -1.0 = incipient drought; -1.0 to -2.0 = mild drought; -2.0 to -3.0 = moderate drought; -3.0 to -4.0 = severe drought; and greater than - 4.0 = extreme drought while similar adjectives are attached to positive values of wet spells.
The chart reflects what has been the case for a while with the eastern half of the country far wetter than the western half where long-standing drought conditions are pervasive.
California, the nation's largest agricultural producing state, remains in the grips of a severe years-long drought; the second half of their rainy season has been a complete bust with their -5.46 end of March PSDI reading the third lowest since 1960.
Montana's -5.56 reading is even lower and 2nd worst since 1960 with Oregon having their lowest PDSI reading at least since 1960.
CO, NE and ID are either seeing their third or fourth driest PDSI readings.
Contrast this with IL, IN, MI, MO and OH where soils are more than sufficiently wet.
After last year's droughts resulted in the lowest U.S. wheat crop in 20 years it was hoped that there would be some improvement.
Right now the U.S. winter wheat area that accounts for a large percent of total wheat output is seeing a number of top HRW and white wheat states possessing very low moisture reserves at a time when the latest 30 and 90-day NWS forecasts are not too encouraging about precipitation in many of these regions.
(c) Copyright 2022 DTN, LLC. All rights reserved.


Comments
To comment, please Log In or Join our Community .