

Fundamentally Speaking
Last Fall & First Spring Winter Wheat Crop Ratings

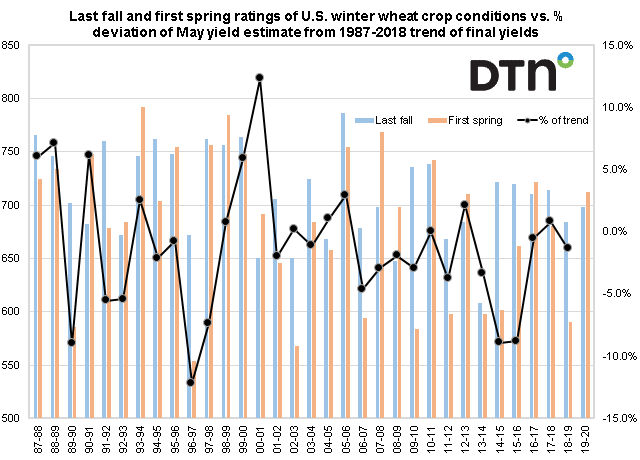
The first spring rating of winter wheat conditions were released by the USDA and while there has much much hand-wringing about the deleterious impact of heavy rains on the outlook for the 2019 growing season, for the bulk of the nation's winter wheat, especially the hard red variety grown in the Plains, the moisture has actually been very beneficial.
This graphic shows the USDA national crop ratings for the U.S. winter wheat crop two times with the first being the last fall rating that occurs the final week of November and the first spring rating from the first week of April.
We use our usual ratings system where we weight the crop based on the percent in each category and assign that category a factor of 2 for very poor, 4 for poor, 6 for fair, 8 for good, and 10 for excellent and then sum the results.
P[L1] D[0x0] M[300x250] OOP[F] ADUNIT[] T[]
These ratings are plotted vs. the percent that the first USDA winter wheat yield forecast given in May deviates from the 1987-2018 trend of final winter wheat yields.
A year ago the 2018/19 U.S. winter wheat crop really deteriorated over the winter with an end of November 2017 rating of 684 falling to 590 by the first week of April 2018.
This year ratings started out a bit higher at 698 and actually improved to a 712 rating which, other than the 722 rating as of the first week of April 2017, is the highest first spring rated wheat crop since the 2010-11 season.
In fact, this is above the five-year average of 673 and the ten-year average of 662.
The question then is does this "favorable" early season crop rating suggest a good initial 2020 winter wheat yield when the USDA releases the May 2019 crop production report.?
The answer is no for two reasons, the first being that there is still a lot of the growing season left especially the critical head filling period.
Secondly we have often seen large yield changes between the May estimate and the final projection given later in the year in September such as a 7.5 bpa improvement in 2016.
Still, the correlation between the percent yield deviation and the first spring rating is around 48% for the 15-year average vs. a correlation of -3% for the last fall rating.
(KM)
Comments
To comment, please Log In or Join our Community .