

Fundamentally Speaking
July 1 Spring Wheat Rating no Guarantee of Yields
What a difference a year makes.
Much of the Upper Midwest and Northern Plains experienced a severe drought last season, resulting in U.S. spring wheat yields falling well below trend.
This year is different however, for though the Dakotas are still somewhat in a drought situation, the degree is far reduced from 2017 while other major spring wheat producing regions are having very favorable growing conditions.
This is reflected in crop ratings compiled by the USDA that are far above year ago levels.
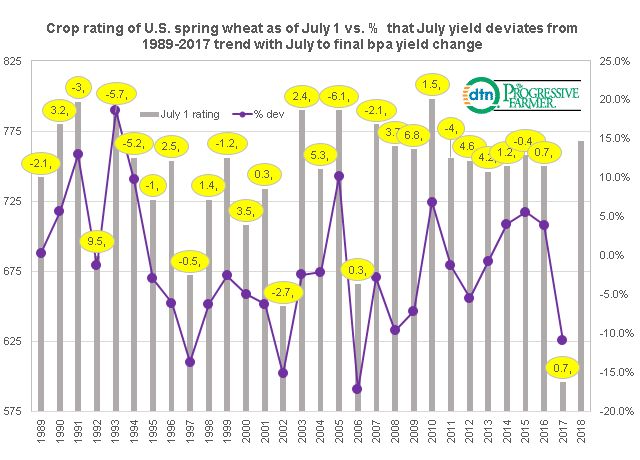
This graphic shows national spring wheat crop ratings as of July 1 using our usual ratings system (where we weight the crop based on the percent in each category and assign that category a factor of 2 for very poor, 4 for poor, 6 for fair, 8 for good, and 10 for excellent and then sum the results).
P[L1] D[0x0] M[300x250] OOP[F] ADUNIT[] T[]
We are assuming that the July 1 rating for the 2018 U.S. spring wheat crop will be similar to the one this week at 768 which if true, would be well above the 596 rating from a year ago which was the second worst in history next to the 394 rating back in 1988.
This is the highest rating since 2010 and before that 2007.
We plot that against the percent that the July wheat yield estimate deviates from the 1989-2017 trend of the final spring wheat yield.
Keep in mind that the spring wheat crop is still in the midst of its critical head filling stage so weather in July is still very important.
Very good crop conditions at the beginning of July are no guarantee of stellar final yields nor does a lackluster July 1 rating mean all is lost.
This is shown by the yellow circles that report the bushel per acre (bpa) change from the July to the final USDA crop production report.
Looking back, some of the highest rated crops as of July 1 have gone on to see very good yields such as in 1990 with a 780 rating resulting in a July yield estimate 5.6% above trend, 796 the following year with the July 1991 yield 13.0% above trend, 1993 at 788 with yield seen 18.6% above trend, 2005 at 790 with yields 10.1% above trend and 2010 at 798 with yields 6.9% above trend.
Yet in 1991 final yields were 3 bpa below the July estimate, 1993 flooding chopped final yields 5.7 bpa from the July estimate and 2005 when final yields were 6.1 bpa below the July projection.
On the other hand, years where the July yield estimate was well below trend saw good weather in July such as 1992 when final yields were 9.5 bpa above the July estimate and 2009 when the July yield estimate at 38.3 bpa which was 7.1% below trend saw final yields 6.8 bpa above that figure.
(KA)
© Copyright 2018 DTN/The Progressive Farmer. All rights reserved.

Comments
To comment, please Log In or Join our Community .