

Fundamentally Speaking
Corn Crop Conditions vs. Yield Correlations

The corn market has been absolutely pounded, losing close to 70 cents over the past three weeks on a panoply of negative factors.
The trade news of course is the real headline grabber with the U.S. embroiled in disputes with our two largest customers of Mexico and Japan with the former openly exploring putting tariffs on U.S. supplies.
Though China is not a real player in the global corn market, they again imposed anti-dumping duties on U.S. sorghum.
As the recently released WASDE report indicated a 50 million bushel increase in projected exports of this grain, USDA will have to go back and revisit that issue as that sorghum now looks to be used for the ethanol grind, which will displace corn used for that purpose.
P[L1] D[0x0] M[300x250] OOP[F] ADUNIT[] T[]
Of course, the Chinese trade news on soybeans has been devastating to that market also dragging corn prices down with it.
Another consideration is the stellar condition of the U.S. corn crop with some in the trade now looking for a final yield in excess of 180 bushels per acre after week 25 when USDA rated the U.S. corn crop at 78% good or excellent.
This is a very rare occurrence as only four other times has the combined good or excellent rating exceeded 77% for this point in the growing season since the national crop condition reports started being released in 1986.
In three of those years -- 1986, 1987 and 1994 -- USDA went on to post a record yield, though this was not the case in 1991 when weather the second half of the summer deteriorated.
Even though conditions right now are quite stellar, as 1991 shows, things can change dramatically.
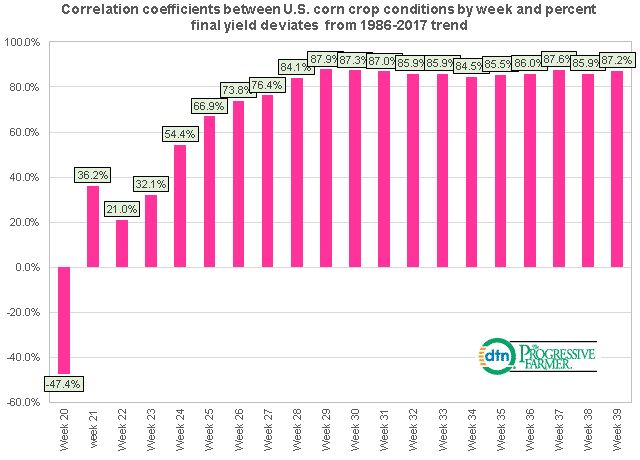
We recently updated our chart of the correlation between national crop conditions each week of the growing season vs the percentthe final U.S. corn yield deviated from the 1986-2017 trend.
In April and May as one would expect there is little correlation but by the time we get to mid-June, week 25, the correlation starts to increase.
Once you get toward the end of July the correlation becomes very high, in the neighborhood of 85-88%.
After pollination, most of the danger point has passed, though weather during grain fill and when the first fall freeze arrives in the Corn Belt are also important influences.
(BAS)
© Copyright 2018 DTN/The Progressive Farmer. All rights reserved.
Comments
To comment, please Log In or Join our Community .