

Canada Markets
Canada's Grain Exports to China During the First Half of 2023-24
The Canadian Grain Commission's January Exports of Canadian Grain and Wheat Flour report shows total licensed exports of major crops at 22.252 million metric tons (mmt), down 2.7 mmt or 10.8% from the same period one year ago.
Looking at the largest crops, wheat exports are 710,400 metric tons (mt) ahead of one year ago, while durum exports are 1.125 mmt behind the year ago pace. Other large year-over-year changes include a 757,800 mt drop in barley exports along with a 1.415 mmt drop in canola exports.
P[L1] D[0x0] M[300x250] OOP[F] ADUNIT[] T[]
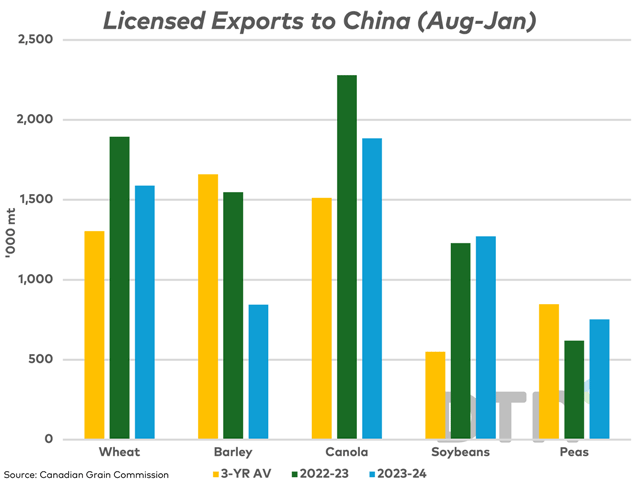
The attached chart shows exports to China over the August-through-January period, while comparing to year-ago data and the three-year average. Of the five crops shown on the chart, the combined year-over-year change in exports to China totals 1.228 mmt, accounting for 45% of the year-over-year drop in total exports for all crops. Wheat exports are reported 305,600 mt lower, barley exports down 702,500 mt and canola down 394,600 mt. Exports of soybeans and peas are slightly higher than the same period in 2022-23.
When one considers the pace of exports to China over recent years, we see that on average, exports are more heavily weighted in the first half of the crop year, indicating that the potential to increase exports in this direction over the last half posing a challenge. For example, during the past three years, soybean exports to China as of January as a percentage of total crop year exports to China account for 95.4% to 100% of total exports, averaging 97%, with product shipped ahead of increasing availability of South American supplies.
When it comes to other crops shown, a three-year average of 63.2% of wheat exports, 65.6% of barley exports and 55.8% of canola exports have been executed by the end of January, with volumes decreasing as we move closer to new crop availability in China.
Cliff Jamieson can be reached at cliff.jamieson@dtn.com.
Follow him on X, formerly known as Twitter, @CliffJamieson.
(c) Copyright 2024 DTN, LLC. All rights reserved.

Comments
To comment, please Log In or Join our Community .