Canada Markets
Statistics Canada September Grain and Product Trade
Statistics Canada reported Canada's exports increased by 2.7% in September while imports rose 1%, with commentary noting increased exports of energy products and agriculture products, notably wheat, due to good demand and an early harvest. Canada's trade surplus increased from $949 million in August to $2 billion in September, only the fourth surplus reported this year and the largest since June 2022 or over one year.
Exports in the broad farm, fishing and intermediate food products group rose by 8.1% in September to $4.924 billion, the largest rise in five months.
The following is a look at miscellaneous trade data for crops and products, focusing on crops where monthly data provides much greater insight than the CGC's weekly data.
Lentil exports totaled 199,662 metric tons (mt), the largest volume shipped in four months. Measured in dollar value of sales, 42% was shipped to India and 15% was shipped to Turkey. Cumulative exports total 244,346 mt, down 38.1% from a year ago and 35.7% below the five-year average. Cumulative exports have reached 17.5% of the current AAFC export forecast of 1.4 million metric tons (mmt), ahead of the pace needed to reach this forecast.
Canada's dry pea exports totaled 439,551 mt, the largest monthly volume shipped in 12 months. Measured in dollar value, 79% was shipped to China, while the 366,256 mt shipped to China was the largest monthly volume shipped to this country since September 2021 or two years. Over two months of the 2023-24 crop year, 539,015 mt has been shipped, down 11.4% from the same period last crop year and down 23% from the five-year average. Based on AAFC's 1.9 mmt export forecast, 28.4% of the forecast exports have been achieved, well ahead of the pace needed to reach this forecast.
Chickpea exports totaled 16,196 mt, the largest volume shipped in three months. Measured in value, 25% was shipped to the United States, with smaller amounts spread across several countries. Over two months, 26,550 mt have been shipped, down 15% from a year ago and 45.5% higher than the five-year average. The cumulative volume has reached 22.1% of AAFC's forecast exports, which is ahead of the pace needed to reach the current export forecast of 120,000 mt.
P[L1] D[0x0] M[300x250] OOP[F] ADUNIT[] T[]
Canary seed exports totaled 7,860 mt, up sharply from the previous month and the largest monthly volume shipped in three months. Measured in value, 51% was shipped to Mexico, while the next largest destination was the U.S., where 9.2% of the total value was shipped. Over two months, 12,037 mt has been shipped, down 49% from a year ago while down 43.3% from the five-year average. Cumulative exports have reached just 9% of AAFC's forecast of 135,000 mt, well behind the pace needed to reach this forecast.
Mustard exports in September are shown at 6,735 mt, the largest monthly volume shipped in three months. Measured in the dollar value shipped, 52% was shipped to the U.S. and 18% was shipped to Belgium. A calculated 13,004 mt has been shipped over the August-September period, down 16.8% from one year ago and 17.9% below the five-year average. AAFC is forecasting 125,000 mt of mustard exports in 2023-24, while the current volume reflects 10.4% of this forecast, with exports behind the steady pace needed to reach this forecast.
Flax exports in September are reported at 11,217 mt, falling for a second month and to the lowest volume reported in 11 months. A reported 70% was shipped to the U.S., while the modest 2,315 mt shipped to China was up slightly from the previous month but remains close to the lowest monthly volume shipped since January of this year. Over two months, Canada has exported 25,054 mt, up 34% from the same period in 2022-23 while is 33.9% below the five-year average for this period. AAFC has forecasted 2023-24 exports at 300,000 mt, up from 215,000 mt shipped in the previous crop year, while the current pace of movement is well behind the steady pace needed to reach this forecast.
Canada's soybean exports in September, the first month of the row crop year, totaled 83,591 mt, the smallest September volume shipped in nine years. Measured in dollar value, 41% was shipped to Japan and close to 10% was shipped to the U.S., the two largest destinations over the month. Total shipments of 83,590 for 2023-24 are down 20.4% from the same period last year and down 43.8% from the five-year average. The current demand forecast released by AAFC is 4.8 mmt, while September exports are far behind the steady pace needed to reach the current forecast.
September corn exports are seen at 47,764 mt, the smallest volume shipped in 11 months. When the value of the shipments is used, 99% of the total volume was shipped to the U.S. As of September, exports are down 29.2% from last year and 5.5% from the five-year average. Total exports have achieved just 2.6% of the current AAFC forecast for 2023-24, well behind the volume needed this month to stay on the steady path to reach the current forecast.
Canada's corn imports totaled 224,181 mt in September, up 120.6% from one year ago and 34.6% higher than the five-year average for this month. This volume marks the highest September volume import since 2009.
Canola oil exports totaled 293,346 mt in September, the highest volume shipped in six months. Cumulative exports over the two months of 2023-24 are 565,980 mt, up 43.7% from the same period last crop year and 28.6% higher than the three-year average.
Canola meal exports totaled 466,361 mt in September, the smallest volume shipped in three months. Exports over two months total 959,787 mt, up 17% from the same period in 2022-23 and 24.9% higher than the three-year average.
Canada's ethanol imports totaled 225 million liters, falling for a second month. Over the nine months of 2023, imports have a total of 1.965 billion liters, with imports up 53.5% from last year and 93% higher than the three-year average.
Biodiesel imports in September totaled 55,656 mt, falling for a third month to the smallest volume reported in six months. Cumulative imports for 2023 are seen at 641,953 mt, up 28.4% from one year ago and 32.4% higher than the three-year average.
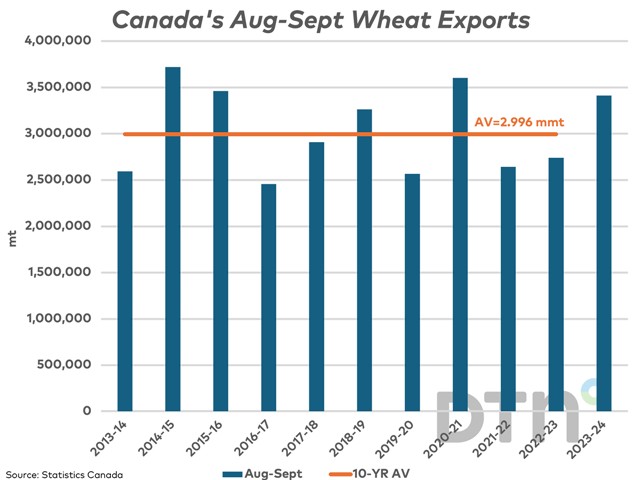
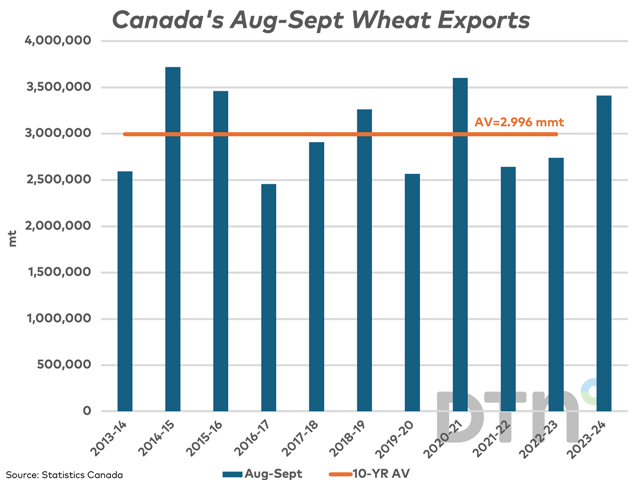
Statistics Canada's commentary points to good movement of wheat in September contributing to the overall increase in the farm, fishing and intermediate food product category exports. As seen on the attached chart, exports of wheat (excluding durum) over the first two months total 3.413 mmt over the first two months of the crop year, up 24.5% from the same period a year ago and 13.9% higher than the 10-year average for this period. It is interesting to note that exports from licensed terminals as of week 9, or the week ending Oct. 1, total 3.2922 mmt as reported by the Canadian Grain Commisssion, which indicates unlicensed cross-border exports of 121,000 mt.
Cliff Jamieson can be reached at cliff.jamieson@dtn.com.
Follow him on X, formerly known as Twitter, @CliffJamieson.
(c) Copyright 2023 DTN, LLC. All rights reserved.


Comments
To comment, please Log In or Join our Community .