

Canada Markets
Soybean Oil Technical Signals

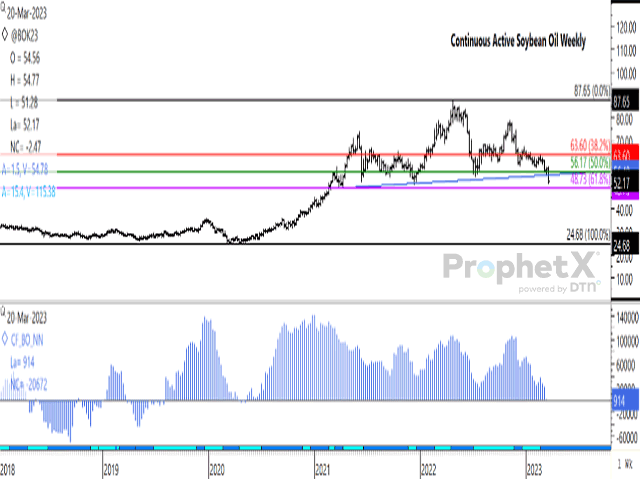
May soybean oil fell 2.47 cents per pound on Wednesday, a third consecutive lower close that has resulted in a drop of 5.82 cents or 9.2%. The continuous active chart shows trade reaching the lowest level seen since Dec. 15, 2021.
This week's move points to a breach of the support of the 50% retracement of the move from March 2020 low of 24.68 cents/lb. to the April 2022 high of 87.65 cents. This retracement line is calculated at 56.17 cents, as shown by the horizontal green line. The next potential support lies at the December 2021 weekly low of 51.10 cents, while the 61.8% retracement of the long-term uptrend lies at 48.73 cents.
P[L1] D[0x0] M[300x250] OOP[F] ADUNIT[] T[]
Another bearish technical signal is a breach of a head-and-shoulders neckline this week, as seen on the attached chart. The pattern consists of a left shoulder reached in June 2021, a head at the April 2022 high and the right shoulder at the November 2022 high. This week's breach of the neckline at 54.78 is troubling, with technical analysis theory pointing to a potential drop from the breached neckline that is equivalent to the distance from the neckline to the head of the pattern. This would point to a potential drop of 35.59 cents from the breached neckline, which points to a target of 19.19 cents, or below the 2020 low. This would be an extreme move and changes in fundamentals could take control in determining direction.
The lower study points to the recently released CFTC data as of the week of March 14, which shows the noncommercial net-long position falling from 21,586 to just 914 contracts, a 20,672 contract or 96% drop from the previous week. This position will soon be reported as a bearish net-short position, which hasn't been seen since May 2020, when a net-short position was held by speculative traders for four consecutive weeks. During the past five years, weekly CFTC data shows noncommercial traders holding a bearish position in 58 weeks, or just 22% of the time.
Cliff Jamieson can be reached at cliff.jamieson@dtn.com
Follow him on Twitter @Cliff Jamieson
(c) Copyright 2023 DTN, LLC. All rights reserved.
Comments
To comment, please Log In or Join our Community .