

Canada Markets
March Canola Tests Range Lows

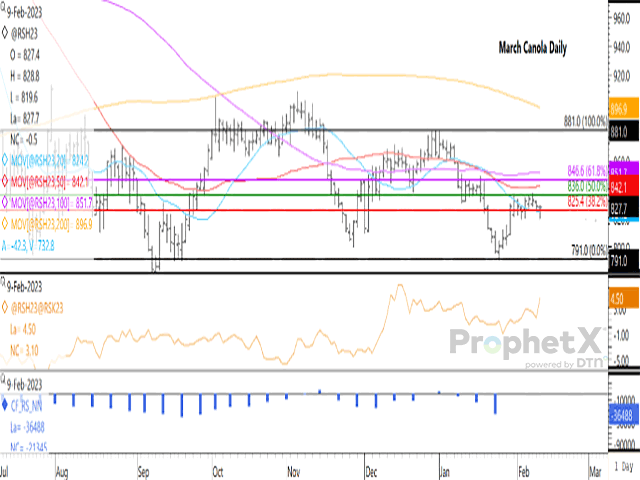
March canola closed $0.50/metric ton lower on Thursday to close at $827.70/mt, after trading as much as $8.60/mt lower while coming within $0.20/mt from testing the low reached on Feb. 2. This is the lower end of the $17.30/mt range traded during the past eight sessions. Today's close was $8.10/mt above the session's low, with potential commercial activity supporting price at the lower-end of the range.
Thursday marks the third consecutive lower close, after price failed at resistance at $836/mt two times in six sessions. This resistance, as seen by the horizontal green line on the chart, represents the 50% retracement of the move from the contract's December high of $881/mt to January low of $791/mt. A breach of this resistance could lead to a continued move to the 50% retracement level of $846.60/mt.
P[L1] D[0x0] M[300x250] OOP[F] ADUNIT[] T[]
Today's close ended above the contract's 20-day moving average for a fifth session, calculated at $824.20/mt. Today's trading bar also shows close to a perfect doji candlestick or bar formed, with today's open and today's close only $0.30/mt apart. This could be viewed as only mildly bearish, with the open and close in negative territory, while close to the upper end of the session's range.
The March/May spread shot to a close of $4.50/mt (first study), the largest spread seen since Dec. 16. This continues to signal supportive trade seen in front-end trade, despite the uncertainty and noise seen in the global oilseed and vegetable oil market. This activity is also affecting trade later in the crop year, with the May/July spread moving into inverted territory for the second time this week, closing at $1.50/mt (May over the July), for the largest inverse reported since Jan. 3.
The blue histogram bars of the lower study shows the noncommercial net-short position, which has yet to be updated since Jan. 24 due to technical issues faced by the CFTC. It is important to note that the noncommercial net-short position as of Jan. 24 of 36,488 contracts was the largest bearish position seen since late September. It is also interesting to note that the week-over-week increase in the size of this bearish position is 21,345 contracts, which is the largest week-over-week change in a canola net-short position on record.
Commercial and noncommercial traders are clearly viewing this market differently, while time will tell which side of this trade has it right.
Cliff Jamieson can be reached at cliff.jamieson@dtn.com
Follow him on Twitter @Cliff Jamieson
(c) Copyright 2023 DTN, LLC. All rights reserved.
Comments
To comment, please Log In or Join our Community .