

Canada Markets
March Oats Signal Indecision

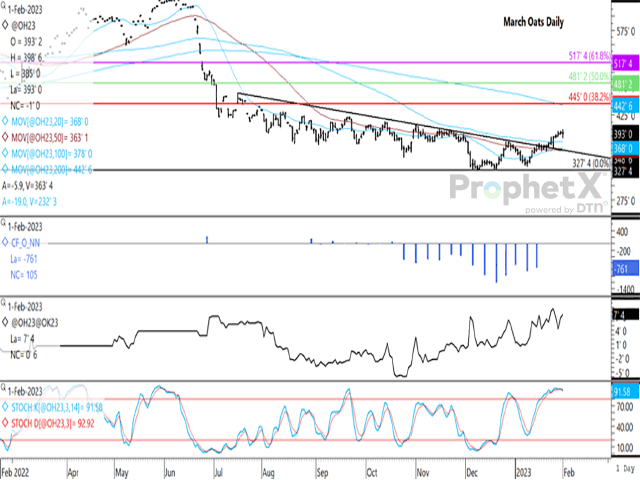
March oats reached a contract low of $3.27 1/2/bushel on Dec. 8, while the continuous active chart (not shown) shows this to be the lowest level traded since Dec. 10, 2020. A late-December rally saw price rally to the resistance of the downtrend line drawn from a July 18, 2022 high on the March chart.
Price failed to test this downtrend line, leading to a correction to the Jan. 10 low of $3.34 1/2. This was followed by five consecutive higher closes that set the stage for a test of the resistance line, which was breached on Jan. 20 and led to six consecutive higher closes from Jan. 24 to Jan. 31.
Feb. 1 trade saw a fresh high of $3.98 3/4 per bushel (bu) reached, the highest trade in more than 12 weeks, or since the week of Oct. 31, only to close 1-cent lower. Today's move printed a bearish outside bar on the daily chart, trading both higher and lower than Tuesday's range, only to close lower. The Feb. 1 trading bar or candlestick has also resulted in a near perfect doji, with today's open of $3.93 1/4/bu only 1/4 cent higher than today's close. This signal could be viewed as mildly bearish, with today's loss only 1 cent while closing 8 cents above the session's low.
P[L1] D[0x0] M[300x250] OOP[F] ADUNIT[] T[]
The short-term uptrend remains intact, with potential support at the contract's 100-day moving average at $3.78/bu. Weekly lows from $3.60 3/4/bu to $3.61 1/2/bu may also be tested, while the downward-sloping trend line, once viewed as resistance, may also be tested, with potential support at $3.63 1/2/bu.
The blue histogram bars of the first study shows noncommercial traders net-short oat futures over the past 13 weeks, a period of bearish activity not seen since October 2016.
The second study shows the March/May inverse strengthening today to 7 1/2 cents (March over the May), while relatively close to the 8 3/4 cent inverse reached on Jan. 26, the strongest inverse seen during the life of the contract.
The lower study shows stochastic indicators on the daily chart forming a bearish cross in overbought territory, potentially signaling a move lower.
Cliff Jamieson can be reached at cliff.jamieson@dtn.com
Follow him on Twitter @Cliff Jamieson
(c) Copyright 2023 DTN, LLC. All rights reserved.
Comments
To comment, please Log In or Join our Community .