Canada Markets
Canadian Wheat Exports Continue Ahead of Forecast
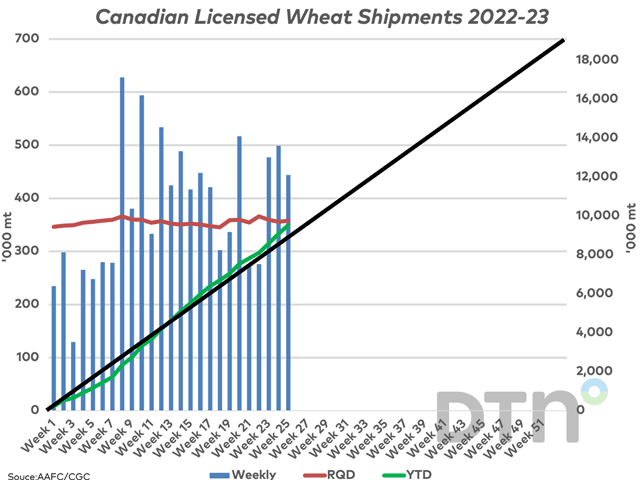
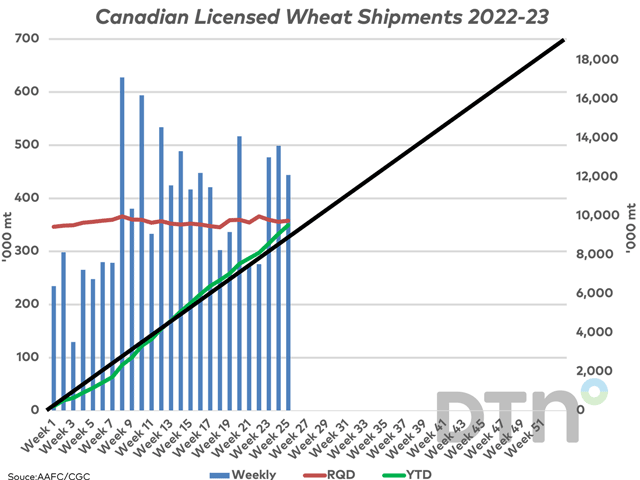
The Canadian Grain Commission's week 25 Grain Statistics Weekly, covering activity for the week ending Jan. 22, shows 443,900 metric tons (mt) of wheat exported through licensed facilities, the smallest volume shipped in three weeks, although still above the volume needed this week to reach the current export forecast of 19.1 million metric tons (mmt), as indicated by the red line on the attached chart.
During the past 25 weeks, the volume shipped has exceeded the volume needed for the week to reach AAFC's forecast in 13 of the weeks, including the past three consecutive weeks.
Two points should be made here. First, the red line is close to horizontal on the chart as AAFC's crop year export forecast is revised higher. Since the first forecast for the 2022-23 was released by AAFC in January of 2022, the wheat export forecast (excluding durum) has been revised higher nine times to the current 19.1 mmt forecast. This includes the past five months, from September through January.
P[L1] D[0x0] M[300x250] OOP[F] ADUNIT[] T[]
Secondly, the weekly export volumes, as indicated by the blue bars on the attached graph, do not include unlicensed exports and the export of flour. In other words, weekly export volumes are understated.
As of week 25, cumulative exports total 9.5281 mmt (green line), which is roughly 345,000 mt ahead of the steady pace needed to reach the forecast. Watch for further upward revisions as we move into the second half of the crop year.
The CGC's week 25 commercial wheat stocks are reported at 2.8057 mmt, which is up 6.2% from the same week in 2021-22 and 0.9% higher than the five-year average. Of this volume reported for the most recent week, 46.2% is situated in terminal positions, which compares to 42.6% of commercial stocks found in terminal positions on average during the past five years.
During the past five years, CGC data shows that exports are close to evenly spread between the first half and the second-half of the crop year. From 2017-18 to 2021-22, an average of 49.3% of the CGC's reported exports has been achieved through licensed facilities during the first 26 weeks or as of the end of January. This ranges from a low of 42.9% of exports shipped in the first six months of 2019-20, while the remaining four years range from 49.1% to 51.9% of total shipments achieved in the first 26 weeks or first half of the crop year.
Cliff Jamieson can be reached at cliff.jamieson@dtn.com
Follow him on Twitter @Cliff Jamieson
(c) Copyright 2023 DTN, LLC. All rights reserved.


Comments
To comment, please Log In or Join our Community .