

Canada Markets
A Look at Hopper Car Demand and Cars Spotted by Corridor

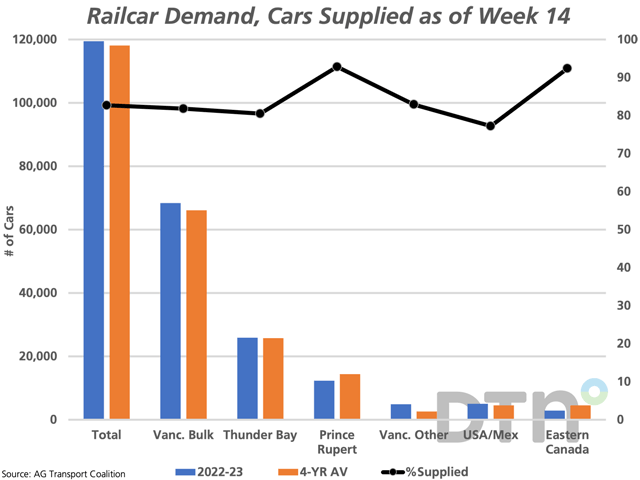
As of week 14, the AG Transport Coalition reports cumulative hopper car demand at 119,440 cars, up 25.6% from the same period in 2021-22 and 1.2% higher than the four-year average for this period. This level of demand is higher than three of the past four years.
When compared to last year's demand across the six shipping corridors, demand across all but the Eastern Canada corridor is higher than seen in the same 14-week period in 2021-22, ranging as high as 135.6% higher for the Vancouver Other/Western Canada corridor with the demand for Prince Rupert 62.7% higher than one year ago over the 14 weeks.
When this demand is compared to the four-year average by corridor, the current demand for shipping is lower for both Prince Rupert and Eastern Canada, as seen in the comparison on the attached chart (blue bars vs. brown bars).
P[L1] D[0x0] M[300x250] OOP[F] ADUNIT[] T[]
The black line with markers highlights the railways' performance in meeting the above demand, as measured against the percentage scale on the secondary vertical axis on the attached chart. Over 14 weeks, the railroads have met 82.7% of the reported demand for all shipping corridors. This ranges from as low as 77.2% of the demand met for the USA/Mexico shipping corridor, to as high as 92.8% of the demand faced for the Prince Rupert corridor.
When the overall size of the corridor is taken into account, we see that difference between cars ordered and supplied for the Vancouver Bulk corridor is 12,474 cars, or 60.5% of the shortfall, while this calculation for the Thunder Bay corridor is 5,040 cars, or 24.5% of the total shortfall.
**
DTN Virtual AG Summit
This year's DTN Ag Summit will be held virtually on the mornings of Dec. 12-13, so you can join from the comfort of your own home. Further details can be found at http://www.dtn.com/…
Cliff Jamieson can be reached at cliff.jamieson@dtn.com
Follow him on Twitter @Cliff Jamieson
(c) Copyright 2022 DTN, LLC. All rights reserved.
Comments
To comment, please Log In or Join our Community .