

Canada Markets
Fall of 2022 is No Time for Railways to Slow Down

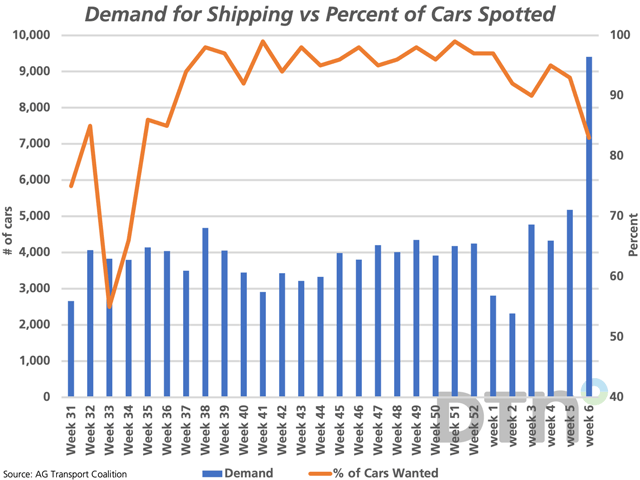
The attached graphic signals a concerning divergence in data seen in the AG Transport Coalition's Weekly Performance Update. Of course, one week's data does not make a trend but this bears watching.
The blue bars represent the demand for hopper cars for loading by the largest shippers, as plotted against the primary vertical axis. In week six, or the week ending Sept. 11, this number swelled by 82% from the previous week to 9,409 cars, which is the highest demand for shipping seen since week 39 of the 2020-21 crop year, or 71 weeks. This compares to 8,007 cars wanted for the same week in 2021-22 and the three-year average of 8,496 hopper cars.
P[L1] D[0x0] M[300x250] OOP[F] ADUNIT[] T[]
Of this number of cars in demand, 62% was seen on CP track, while 38% was on CN track. An estimated 63% of the total demand was for the Vancouver Bulk corridor, an additional 7.2% was for Prince Rupert, while 21.3% of the cars were wanted for Thunder Bay shipping.
The brown line with markers highlights the sharp downturn in the percentage of cars spotted for loading within the week wanted (week six), falling from 93% for Canada's two major railways in week five to 83% in week six, as measured against the primary vertical axis. The difference is 1,561 hopper cars, or over an estimated 140,000 mt. This is the lowest percentage reported since week 34 of last crop year, or 24 weeks which is close to six months.
This result was due to a further divergence in the data report for the two railways, with CN spotting 98% of the cars wanted for loading during the week, up one point from the previous week, while CP saw performance slip from 92% in week five to 74% in week six.
According to Statistics Canada's latest production estimates, total production from Manitoba through British Columbia is 75.230 mmt, up 53.5% from last crop year and 8.1% higher than the five-year average. With winter ahead, this is no time for movement to falter.
Cliff Jamieson can be reached at cliff.jamieson@dtn.com
Follow him on Twitter @Cliff Jamieson
(c) Copyright 2022 DTN, LLC. All rights reserved.
Comments
To comment, please Log In or Join our Community .