

Canada Markets
A Look at Potential Canola Supplies for 2022-23
The November canola future has lost $13/metric ton since Statistics Canada released this week's production forecast that revised production lower by 400,000 mt to 19.1 million metric tons. One can only wonder just how long noncommercial traders, who have increased their bearish net-short position in canola futures in nine of the past 10 weeks, can continue to set the direction for prices.
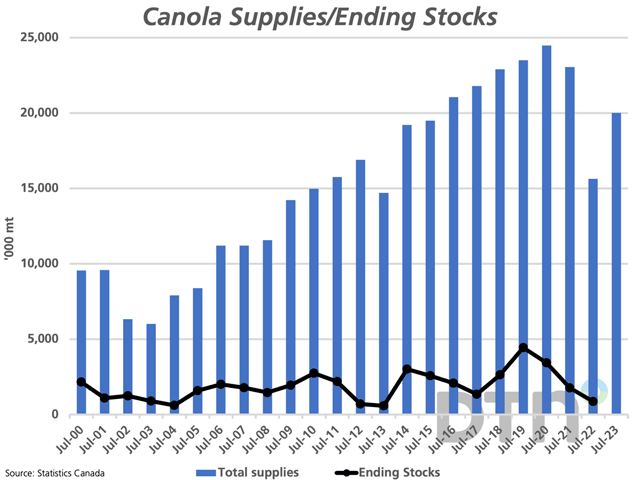
As seen on the attached chart, estimated supplies for 2022-23 of 20 mmt (ignoring a small volume of imports), are forecast to jump by 28% from the previous year's drought-reduced crop. If we treat 2021-22 as an outlier, 2022-23 supplies would be marginally higher than reported for 2013-14 and 2014-15, while lower than reported from 2015-16 through to 2020-21. The average during this six-year period (2015-16 to 2020-21) is 22.8 mmt. This coincides with a growing global demand for vegetable oils, with the USDA reporting demand for the major vegetable oils increasing by 55.46 mmt or 35% from 2012-13 to their estimate for 2022-23.
Despite the drop in price, the Nov/Jan futures spread has remained steady at minus $8/metric ton for three consecutive sessions, a sign of a neutral response on the part of commercial traders. While this spread shows an $8/mt inverse on this day last year (November above the January), the five-year average prior to that (2016-17 to 2020-21) averaged minus $7/mt.
P[L1] D[0x0] M[300x250] OOP[F] ADUNIT[] T[]
Here are a few factors to watch:
1) The ICE Canada Canola Board Margin Index has remained elevated at historic highs above $200/mt over recent weeks, providing a strong signal to crush. The Canadian Grain Commisssion reported domestic disappearance at 64,900 mt in week 4, 162,500 mt in week 5 and 196,900 in week 6.
2) The Grain Marketing Program's Weekly Performance Update shows the Vancouver vessel list for week 6 jumping by 100% from the previous week, or from 11 vessels to 22 vessels, above the one-year average of 14/week. The question remains what will get loaded.
3) Movement from the country is picking up. The AG Transport Coalition's Daily Network Status Report as of Sept. 14 shows the daily average for loads on wheels so far in week 7 is at 8,689 hopper cars/day, up 56% from the same period in the previous week. The daily average for western terminal unloads is seen at 1,333 cars, or 82% higher than the same period last week.
4) On the supply side, this week's Statistics Canada average yield for Saskatchewan is 37.8 bushels per acre, which compares to the Saskatchewan government estimate of 34 bpa. The difference of 3.8 bpa across the 11.3171 million harvested acres estimated for the province by Statistics Canada is approximately 975,000 mt. A supply-side surprise remains a possibility.
Cliff Jamieson can be reached at cliff.jamieson@dtn.com
Follow him on Twitter @Cliff Jamieson
(c) Copyright 2022 DTN, LLC. All rights reserved.

Comments
To comment, please Log In or Join our Community .