Canada Markets
Licensed Grain Deliveries as a Percent of Farm Supplies
Just days away from the mid-point of the 2021-22 crop year on Jan. 31, we look at deliveries of select crops into the licensed handling system as of week 25, or the week ending Jan. 23. Given the tight farm stocks as of July 31 or the end of the 2020-21 crop year, combined with the sharply reduced 2021 crop and the resulting high prices realized, the second half of the current crop year will prove interesting and will quickly test the accuracy of current official estimates. As well, this data may indicate the resolve of sellers to hold for even higher prices.
Producers delivered 658,600 metric tons of the major crops into the licensed handling system in week 25, down sharply from the 1.0662 million metric tons (mmt) delivered in the week prior. Week-over-week deliveries fell in 11 of the 15 crops reported, with roughly 33% of the drop linked to a drop in wheat deliveries and 37% attributed to a drop in canola deliveries.
When compared to the 2021-22 crop year, cumulative deliveries of the select crops seen on the attached chart range from barley, with cumulative deliveries down 5.4% from 2020-21 and 18.5% higher than the three-year average, to flax, with cumulative deliveries down 55.2% from last crop year.
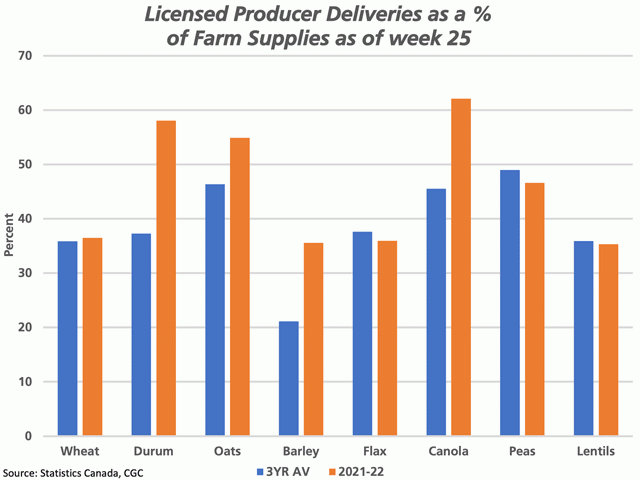
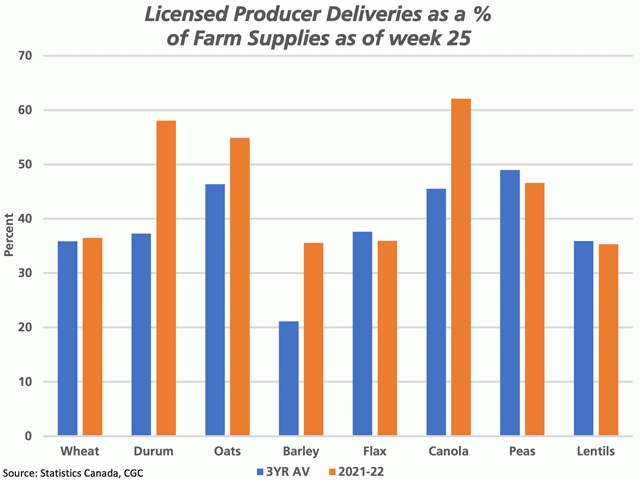
When we calculate cumulative deliveries into licensed facilities as a percentage of total available supplies, defined as Statistics Canada's July 31 farm stocks estimate added to the agency's estimated 2021 production, the attached chart shows as much as 62% of available canola has been delivered, with durum close behind at 58.1% (brown bars). When compared to the three-year average for this week, we see that the percentage calculated for durum is 20.8 percentage points above average, while the percentage calculated for canola is 16.6 points higher than average.
P[L1] D[0x0] M[300x250] OOP[F] ADUNIT[] T[]
Despite the smaller crop of wheat produced in 2021, it is interesting to note that producers have delivered 36.5% of available wheat supplies as of week 25, which is consistent with the three-year average of 35.9%.
One other interesting study (not shown) is where grain stocks are situated in the pipeline relative to average for week 25. As of week 25, 55.8% of commercial stocks of the 15 crops reported weekly by the CGC are situated in primary elevators on the prairies. Despite the significantly smaller crop, this is consistent with the three-year average of 57.4% for this week, while pointing to the challenges faced by the industry in getting grain moved to export positions.
Of the select crops, the crop that is closest to average is canola, with 60.6% of the current commercial supplies situated in country elevators, which compares to the 60.9% three-year average for this week.
**
DTN 360 Poll
This week's poll asks if you think canola's fundamentals will prevail, and if prices will recover from the recent sell-off. Please feel free to share your thoughts on this poll, located at the lower right side of your DTN Canada Home Page.
Cliff Jamieson can be reached at cliff.jamieson@dtn.com
Follow him on Twitter @Cliff Jamieson
(c) Copyright 2022 DTN, LLC. All rights reserved.


Comments
To comment, please Log In or Join our Community .