Canada Markets
The Canola/Soybean Spread Signals Concern
The role of the canola future over the balance of the crop year will be to ration tight supplies. So how tight is canola? Over the first 19 weeks of the crop year, or the week ended Dec. 12, which covers the first 36.5% of the crop year, the Canadian Grain Commission is reporting total disappearance at 6.1282 million metric tons (crush plus exports). While this is down 29.3% from the same period of the 2020-21 crop year, AAFC's current demand forecast is looking for a year-over-year drop of 7 million metric tons (mmt) or 33.3% from 2020-21. The pace of disappearance is slightly ahead of the forecast pace.
While fundamentals for canola seem incredibly bullish, this is the time of year when Australia's supplies carve a piece of global demand, in this case, with a record-sized crop. As well, canola prices need to stay in-check with competing oilseed and vegetable oil prices.
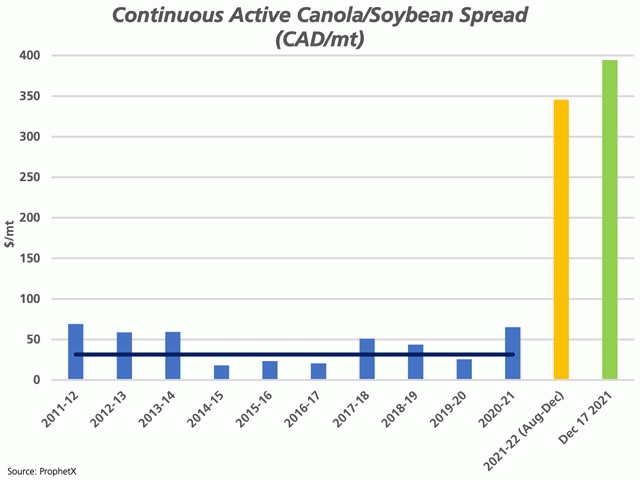
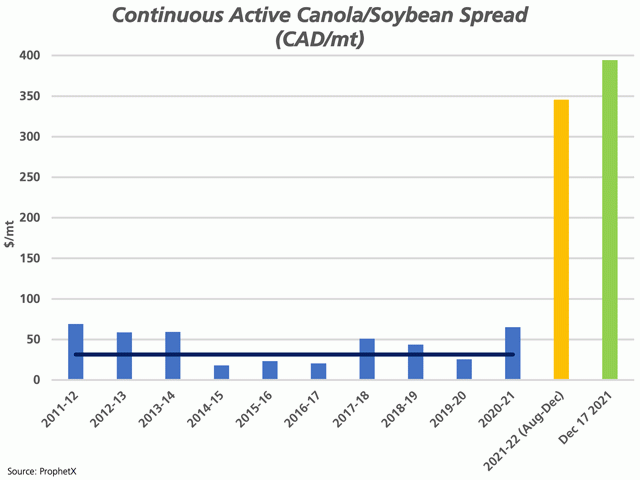
A Dow Jones interview of an unnamed trader this week points to the canola price being "ludicrously overvalued." The attached chart shows the canola/soybean future spread (continuous active future in CAD/metric tons) closed at $394.50/mt on Friday (green bar, canola over soybeans). This compares to the crop-year average of $345.65/mt (yellow bar), calculated from Aug. 1 to Dec. 17.
P[L1] D[0x0] M[300x250] OOP[F] ADUNIT[] T[]
Over the past 10 crop years, ProphetX calculates this spread ranging from $17.89/mt in 2014-15 to $69.01/mt in the 2011-12 crop year. The black line represents the 10-year average of $31.53/mt, as indicated by the horizontal black line).
One glance by a market bear would lead to a conclusion that canola has already made its move and we are fortunate to have experienced all we've seen to date. At the same time, March canola reached its highest trade in eight sessions on Dec. 17 and broke out from a triangle chart pattern that has been in place since Nov. 29, closing back above $1,000/mt.
This week's trade volume in the March was the highest weekly volume over the life of the contract, leading to the first higher weekly close in three weeks. Both the March/May and May/July spreads closed higher this session, with the weekly close for the May/July reaching $50.20/mt, the highest seen over the life of the spread.
One concern should be the noncommercial net-long position, which has grown to a record high of 62,759 contracts, bearing in mind that the CFTC began reporting canola data at the beginning of the 2018-19 crop year. A sudden widespread change in sentiment could spell serious trouble for this market.
Cliff Jamieson can be reached at cliff.jamieson@dtn.com
Follow him on Twitter @Cliff Jamieson
(c) Copyright 2021 DTN, LLC. All rights reserved.


Comments
To comment, please Log In or Join our Community .