

Canada Markets
Week 9 Deliveries as a Percent of Farm Supplies
It will be difficult to make comparisons between 2021 and past years due to the sharply lower production faced on the Prairies while a combination of the smaller crop and favourable weather has led to a harvest pace that is well-ahead of past years. For example, this week's Saskatchewan Crop Report estimated the harvest at 99% complete as of Oct.4, which compares to the five-year average of 79% and the 10-year average of 83%.
Despite the fast pace of harvest, the Canadian Grain Commission's Grain Statistics Weekly for week 9 or the week ending Oct. 3 shows total deliveries of all major crops at 10.4543 million metric tons, down 2.698 mmt or 20.5% from the same period in 2020-21.
Looking across the data for the 15 crops reported, only four crops show cumulative deliveries ahead of last year. So far this crop year, chickpea deliveries are up 3,800 metric tons from last year, mustard deliveries are 1,800 mt ahead of last year, canary seed deliveries are 3,700 mt ahead of last year while of the larger crops, barley deliveries are 405,100 mt or 43.4% higher than the same week last year and 83.2% higher than the three-year average for this period. Prairie production of barley is estimated down 33.5% from last year but exports as of week 9 at 405,400 mt are down only 12.3% from last year.
P[L1] D[0x0] M[300x250] OOP[F] ADUNIT[] T[]
Of the select crops shown on the attached chart, other than barley, producer deliveries as of week 9 range from 20.3% below 2020-21 for wheat (excluding durum) to as much as 43.6% lower for lentils. Durum deliveries are down 29.9%, canola is 21.7% lower, peas are 35.4% lower, oats at 35.7% and flax deliveries are 40.7% behind last crop year's pace.
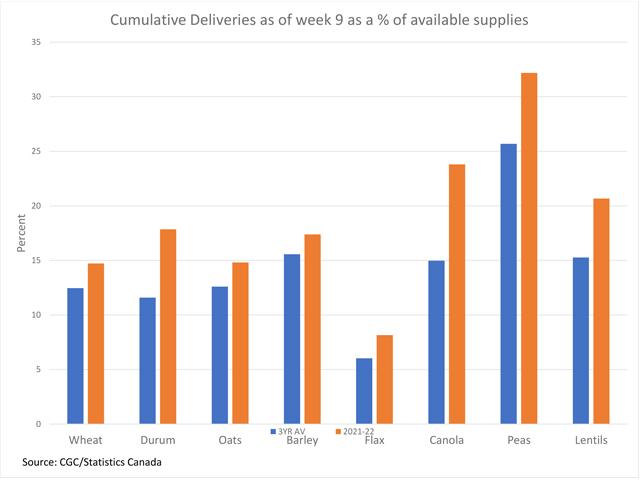
What may be of interest for buyers and sellers alike is cumulative deliveries as a percent of the grain that is available to deliver and how this compares to past years. The brown bars of the attached chart show cumulative deliveries as a percent of the sum of Statistics Canada's July 31 farm stocks estimate plus Statistics Canada's August model-based production estimates.
Chart data shows the current crop year percentage (brown bars) ahead of the three-year average for all of the select crops. The percentage calculated is roughly 2 percentage points higher for wheat, oats, barley and flax. At the same time, deliveries of peas as a percentage of farm supplies are 6.5 percentage points higher than average at 32% and the percentage calculated for canola is close to nine percentage points higher than average at 24%. Week 9 represents 17.3% of the crop year.
This bears watching. As available supplies shrink, buyers will want to tie up stocks to meet future needs. At the same time, sellers will want to capitalize on attractive pricing while buyers are aggressively at work covering their needs.
Of course there are a number of moving parts in this calculation and all will change as Statistics Canada updates its official estimates for both stocks and production.
Cliff Jamieson can be reached at cliff.jamieson@dtn.com
Follow Cliff Jamieson on Twitter @Cliff Jamieson
(c) Copyright 2021 DTN, LLC. All rights reserved.

Comments
To comment, please Log In or Join our Community .