Canada Markets
What Do Week 47 Commercial Stocks Tell us?
The week 47 Grain Monitoring Program Weekly Performance Update shows total grain stocks in terminal positions down 8% from a year ago, with a significant drop of 13% year-over-year on the West Coast. At the same time, when current stocks are compared to the past three years, it is reported that total terminal stocks are up 2% from the average, with West Coast stocks down just 1% from the average.
Current terminal stocks running so close to average this close to the end of the crop year is perhaps a circle that is difficult to square, given forecasts that point to a significant drop in total stocks in 2020-21. Agriculture and Agri-Food Canada's June supply and demand estimates point to crop year stocks of grains and oilseeds to fall by 34.5% in the current crop year, while the drop in volume of all principal crops is forecast to fall by 31% overall.
Looking at government estimates for various crops, ending stocks of canola are to fall to the lowest seen since 2013 at 700,000 metric tons (mt). Wheat stocks (excluding durum) are to fall to 4 million metric tons (mmt), also the smallest seen since 2013. Stocks of durum are to fall to 650,000 mt, the smallest in Statistics Canada data going back to 1986, while barley stocks are to fall to a record low of 500,000 mt.
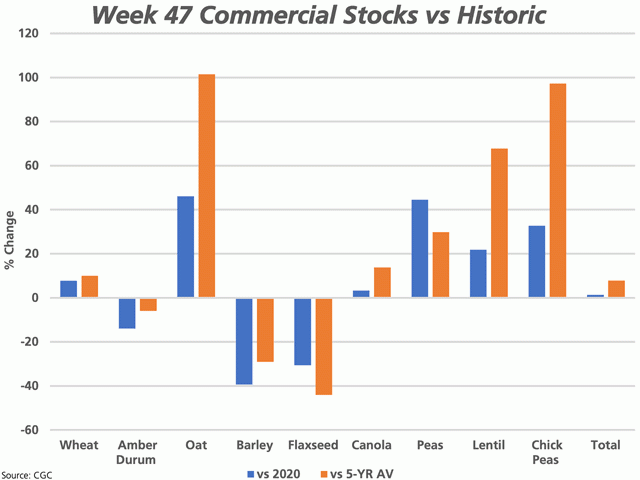
The attached chart shows the reported commercial stocks of various crops as of week 47, compared to 2019-20 (blue bars) and to the five-year average (brown bars). Total commercial stocks as of week 47 are 1.3% higher than last year and 7.8% higher than the five-year average, despite being just a few short weeks away from the end of the crop year.
P[L1] D[0x0] M[300x250] OOP[F] ADUNIT[] T[]
Only flaxseed, barley, and to a lesser extent durum, show the current level of commercial stocks below 2019-20 and the five-year average. The current level of commercial stocks of canola at 1.192 mmt is 3.3% higher than last year and 13.7% higher than the five-year average. Commercial stocks of wheat (excluding durum) at 2.574 mmt are up 7.7% from last year and 10% higher than the five-year average.
The higher level of stocks of the larger crops could be a signal of pending demand and shipments prior to the end of the crop year but may also be signaling that overall stocks are far higher than is shown in current estimates.
To gain an understanding of stocks in commercial storage as of July 31 or the end of the crop year, Statistics Canada data shows that commercial stocks of canola as of July 31 averaged 45% of total stocks reported over the past five years. Commercial stocks of wheat (excluding durum) as of July 31 have averaged 59% of total stocks over the past five years.
**
DTN 360 Poll
This week's poll asks how you would best describe the condition of the crop in your area? You can weigh in with this chart, found on the lower-right of your DTN Home Page.
Cliff Jamieson can be reached at cliff.jamieson@dtn.com
Follow him on Twitter @Cliff Jamieson
(c) Copyright 2021 DTN, LLC. All rights reserved.


Comments
To comment, please Log In or Join our Community .