Canada Markets
Will Canola Stocks Grow in 2021-22?
Focus in the grain markets remains primarily on old-crop trade, with stocks set to tighten across a number of markets while in a perfect world, the addition of the 2021 crop could ease concerns and allow stocks to grow to more comfortable levels.
In the case of canola, the May contract increased by $70.20/metric ton in February, far outpacing the $40.20/mt increase achieved in the new-crop November contract, which was the highest November contract trade seen since October 2012.
To better understand the front-end concerns in the market, we look to the old-crop/new-crop spread, or the July/November spread or inverse. This spread reached a high of $132.40/mt (July trading over the November) in February, while closed at $117.70/mt on March 3. In May of 2013, the old-crop/new-crop spread reached a $94.70/mt inverse, while reaching $75.80/mt in January 2009. This spread is currently shown at unprecedented levels, signaling an extremely bullish view of old-crop fundamentals relative to new-crop.
In a recent Fundamentally Speaking blog written by DTN Contributing Analyst Joe Karlin, the focus shifted from the tight old-crop stocks situation to the 2021-22 crop year and the need to build stocks for both corn and soybeans.
P[L1] D[0x0] M[300x250] OOP[F] ADUNIT[] T[]
(See https://www.dtnpf.com/… and https://www.dtnpf.com/…)
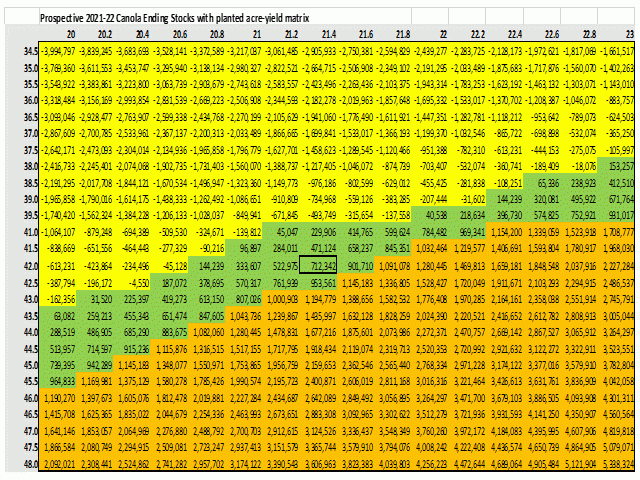
Given a number of assumptions based on USDA forecasts, a planted acre-yield matrix was created to indicate the combinations of planted acres and yields that would lead to a year-over-year increase in stocks.
The attached chart represents similar calculations for canola. Seeded acres are shown to range from 20 million to 23 million across horizontal axis, while yield ranges from 34.5 bushels per acre to 48 bpa on the vertical axis on the left. Assumptions include Agriculture and Agri-Food Canada's forecast 700,000 mt carry-out for 2020-21, which becomes the 2021-22 carry-in, as well as its harvested acre/seeded acre ratio of 99.4% and its current demand forecast of 20.250 million metric tons. This level of demand (crush plus exports) is down 1 mmt or 4.7% from the current crop year forecast.
The highlighted box near the middle of the chart approximately represents the current AAFC forecast which points to 2021-22 stocks remaining unchanged at 700,000 mt. The current forecast includes a 4% increase in seeded acres to 21.6 million acres or the highest in three years. The current yield estimate is 41.4 bpa, 1.3 bpa higher than achieved in 2020 and 0.3 bpa higher than the five-year average.
Given the assumptions made, the combination of the green shaded area (stocks from zero to 1 million metric tons) and the yellow shaded area (negative numbers reflecting the need to trim demand) reflect another year where demand must be rationed and stocks at levels close to the current forecast for 2020-21 or lower. The combinations of yield and acres that are shown in the brown shaded area indicate an opportunity to satisfy increased demand and/or build stocks.
A combination of the record 23 million acres seeded in 2017 and the record 42.3-bpa average yield achieved in 2016 would lead to ending stocks growing to roughly 2.5 mmt, when demand is fixed at the 20.250 mmt level.
Cliff Jamieson can be reached at cliff.jamieson@dtn.com
Follow him on Twitter @Cliff Jamieson
(c) Copyright 2021 DTN, LLC. All rights reserved.


Comments
To comment, please Log In or Join our Community .