Canada Markets
Spring Wheat Breaks Below Support
The March MGEX hard red spring wheat contract realized the smallest loss across the trade of the three wheat classes on Tuesday, although may be signaling the most concerning of the technical signals.
This session saw March Chicago soft red winter wheat close 7 1/2 cents lower and Kansas City hard red winter wheat closed 8 1/2 cents lower, while consolidating within Monday's range in sideways trade. The most active March SRW contract closed below its 100-day moving average for the first time since Aug. 19, although remains above the 50% retracement of the move from its June low through October high. Today's HRW trade resulted in an 8 1/2-cent move lower, while HRW has fared even better from a technical perspective, continuing to hold above the 33% retracement of the move from its August low to October high.
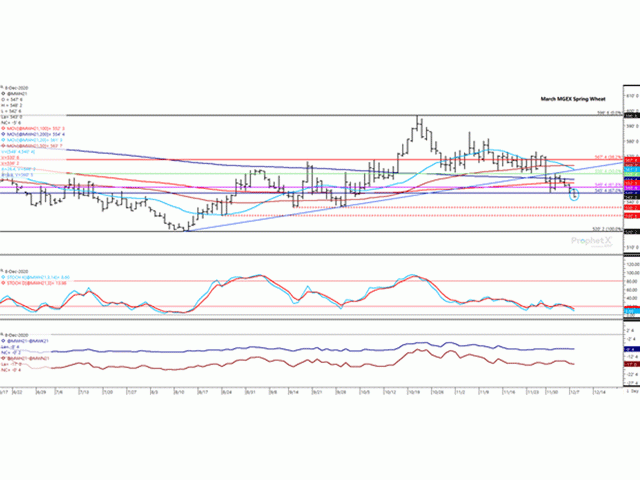
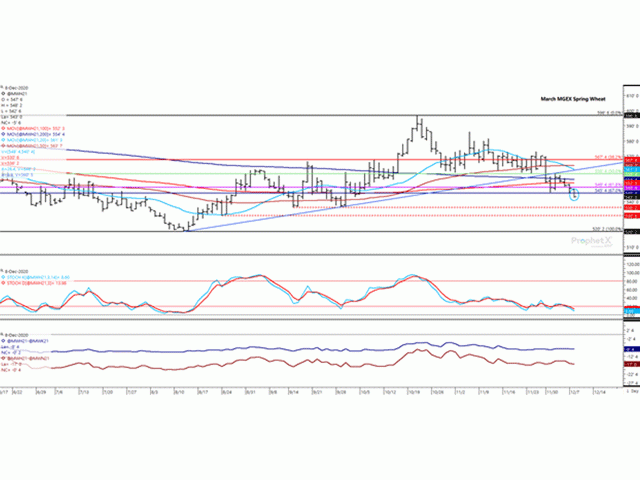
In contrast, Minneapolis hard red spring wheat closed below the 67% retracement of the move from its August low to October high, which is shown by the horizontal line on the chart at $5.45 1/2/bu. This support has been tested since Dec. 1 but was no match for the noncommercial liquidation seen in today's trade.
P[L1] D[0x0] M[300x250] OOP[F] ADUNIT[] T[]
Last week's March close of $5.50 1/2 per bushel (bu) fell at the 18th percentile of the five-year range, down from the previous week. Spring wheat can be viewed as inexpensive relative to the five-year range, while the market continues to seek a bottom.
The horizontal red dotted lines point to chart lows from September at $5.36 1/4/bu (first line), then again at $5.30 3/4/bu. Should today's close below support lead to further weakness, these levels may be key to preventing a full retracement back to the August low.
The lower study shows the March/May futures spread (blue line) and the March/July spread (brown line), which have weakened 1/2 cents and 2 cents so far this week, respectively. DTN analysis points to the March/July carry at more than 3 cents/month USD from March to August as a bearish level of carry and a likely a sign of bearish commercial activity in the market.
**
DTN 360 Poll
This week's poll asks what you think of the interim trade deal announced between Canada and the United Kingdom. You can weigh in with your thoughts on this poll, which is found on the lower-right side of your DTN Canada Home Page.
Cliff Jamieson can be reached at cliff.jamieson@dtn.com
Follow him on Twitter @Cliff Jamieson
(c) Copyright 2020 DTN, LLC. All rights reserved.


Comments
To comment, please Log In or Join our Community .