
Canada Markets
Crop Disappearance Plus Commercial Stocks as a Percentage of Supplies
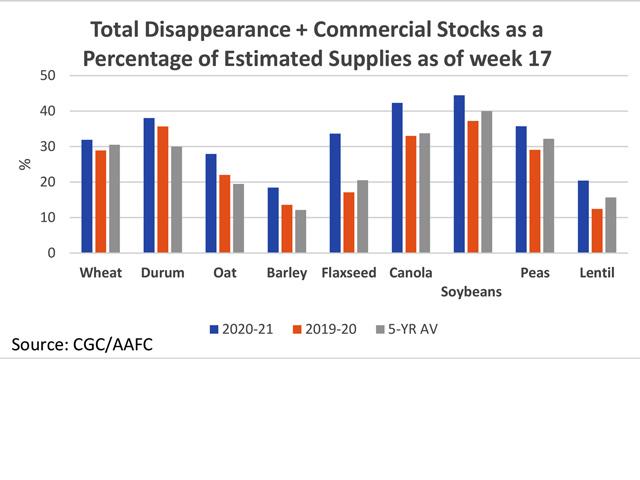
This study has been looked at in recent weeks but has been updated based on Statistics Canada's recent 2020 production estimates. This study may be of particular interest for canola, with the recent Statistics Canada production estimate pointing to a smaller-than-expected crop size.
Based on the latest data, the calculated percentage (exports plus domestic disappearance plus commercial stocks, with the sum divided by the calculated crop year supplies, represented by the blue bars) is higher than 2019-20 and the five-year average for all selected crops on the attached chart.
Of the selected crops, wheat (excluding durum) is shown to be the closest to both 2019-20 data and the five-year average, following the upward revision in the wheat production estimated reported by Statistics Canada on Dec. 3. The sum of the volume that has disappeared through exports or domestic use plus the current commercial stocks as of week 17 represent 31.9% of total estimated supplies, up from 28.9% on this week in 2019-20 and is 1.4 percentage points higher than the five-year average. This is the smallest change from average seen across the selected crops (blue bar compared to the grey bar).
P[L1] D[0x0] M[300x250] OOP[F] ADUNIT[] T[]
The highest percentages calculated are seen for canola at 42.3% and soybeans at 44.5%, which is put into perspective when it is considered that week 17 represents the first 33% or one-third of the canola crop year and 25% of the soybean crop year.
The three volumes in question represent 42.3% of canola's estimated supplies, after Statistics Canada estimated canola production at 18.7 million metric tons on Dec. 3, down from 19.4 mmt that was reported in previous forecasts early in the fall. This is well-above the 33% calculated for this week in 2019-20 and the five-year average of 33.8%. Market commentary today indicated there is a split in the trade on whether the recent forecast is accurate, although Vancouver cash basis has strengthened by $10/mt over the past week ($5/mt each week)and this signals a growing bullish sentiment early in the crop year.
One crop that has shown the greatest change from 2019-20 and the five-year average is flax. Despite a slight upward revision in the flax production estimate reported last week, a combination of favorable exports and domestic use plus elevated commercial stocks are used to calculate a percentage of 33.7%, which compares to just 17.1% this time last year and the five-year average of 20.6%.
**
DTN 360 Poll
This week's poll asks what you think of the interim trade deal announced between Canada and the United Kingdom. You can weigh in with your thoughts on this poll, found on the lower-right side of your DTN Canada Home Page.
Cliff Jamieson can be reached at cliff.jamieson@dtn.com
Follow him on Twitter @Cliff Jamieson
(c) Copyright 2020 DTN, LLC. All rights reserved.

Comments
To comment, please Log In or Join our Community .