Canada Markets
Historical Change in Canadian Crop Production Aug.-Dec. Estimates
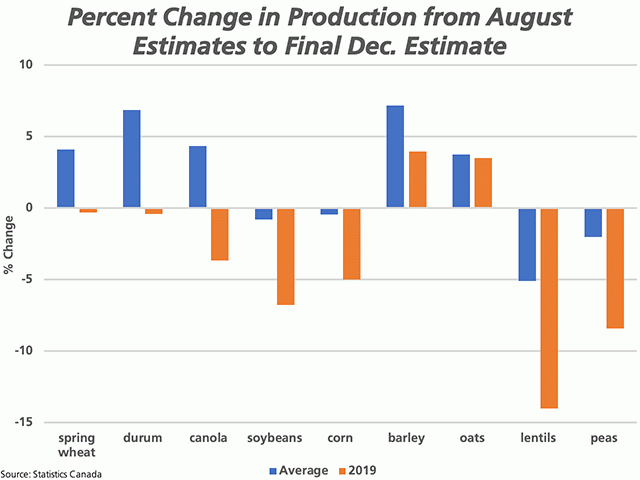
Each year in this space we look at historical trends in the change in crop production estimates from one report to the next. As stated by Mark Twain, "history doesn't repeat itself, but it often rhymes." In this case we are looking at the percent change from Statistics Canada model-based estimates based on August data and released in mid-September to the final estimates released in early December. While the final estimates are never really final, for the purposes of this study, later revisions are not included.
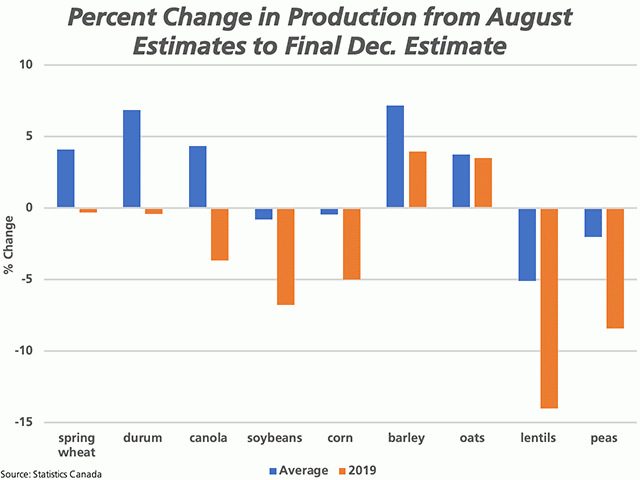
The attached chart compares this change for select crops in 2019 (brown bars) along with the five-year average for spring wheat, durum, canola, soybeans, corn, barley and oats (blue bars) and the three-year average for lentils and peas, also blue bars, due to a lack of report data in earlier years of the model-based reports.
P[L1] D[0x0] M[300x250] OOP[F] ADUNIT[] T[]
On average, the production estimate for spring wheat (4.1%), durum (6.9%),canola (4.3%), barley (7.2%) and oats (3.7%) have increased from the August estimate to the final estimate released in December, with the percent gain in brackets. Of these crops, only barley production has been revised higher in each of the five years (2015-19), while estimates for durum and oats has been revised higher in December in four of the five years.
Estimates for canola, lentils and peas in December have been revised lower in each of the past two years, while estimates for soybeans and corn have been revised lower in each of the past three years.
Statistics Canada will release its 2020 final estimates on Dec. 3.
Cliff Jamieson can be reached at cliff.jamieson@dtn.com
Follow him on Twitter @Cliff Jamieson
(c) Copyright 2020 DTN, LLC. All rights reserved.


Comments
To comment, please Log In or Join our Community .