Canada Markets
A Look at the US Spring Wheat Condition Versus Average
In advance of this week's prairie crop reports and ahead of prairie crop conditions ratings, this analysis looks south along the Canadian border to this week's USDA crop condition and emergence ratings. Data is viewed for the six states monitored, along with the three largest spring wheat producers including Montana, North Dakota and Minnesota. Estimates in the USDA's Prospective Planting report shows these three states expected to plant 10.750 million acres, or 85.4% of the total forecast for the country.
This week's report, as of May 31, estimates the overall six-state spring wheat crop condition at 80% good to excellent, the first estimate of the growing season. As of June 2, 2019 this estimate was shown at 83% good to excellent, while the first condition estimate for the growing season has not been reported above 80% since May 23, 2010 where it is shown at 85%. The five-year average of the first rating of the growing season is calculated at 71.2% good to excellent, while the 10-year average is calculated at 71.8%.
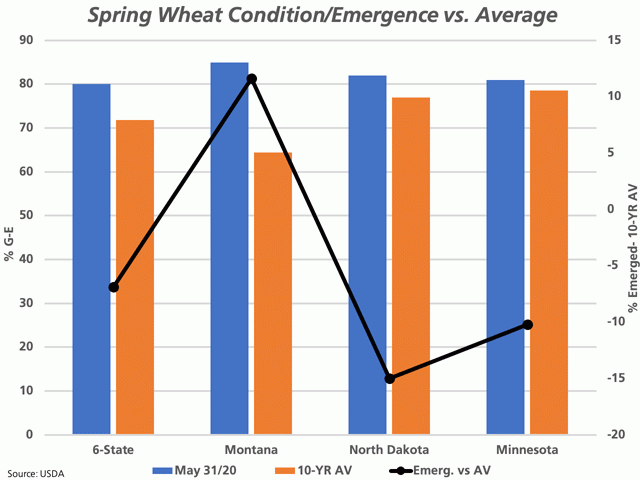
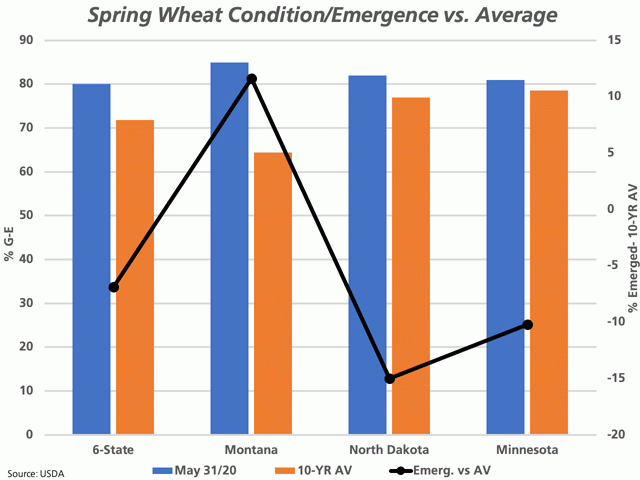
We see on the attached chart that the condition rating shows a decline as you move from west to east. The current rating for Montana is 85% good to excellent, the North Dakota rating is 82% and Minnesota was estimated at 81% (blue bars measured against the primary vertical axis). When compared to the 10-year average (brown bars), the spread between the current rating and the 10-year average also declines as you move from west to east. The current rating for Montana is 20.6 points above its average, the North Dakota spread is 5 points above average while the current-week Minnesota rating is 2.4 points above average.
P[L1] D[0x0] M[300x250] OOP[F] ADUNIT[] T[]
The estimated crop emergence as of May 31 was reported by the USDA at 67% (73.9%) across the six states monitored, with the 10-year average in brackets, calculated for the week that the first condition rating was released. The three major producers show emergence ranging from a high of 83% in Montana (71.4%), 71% in Minnesota (81.2%) and 52% in North Dakota (67%), with the 10-year average emergence also calculated on the week of the release of the initial condition rating. The black line with markers on the attached chart shows the spread between the current emergence estimate and this 10-year average, ranging from a high of 11.6 points above average in Montana to a lag of 15 points in North Dakota.
**
DTN 360 Poll
This week's poll asks what you think the government can do to tame food inflation, as recently experienced due to the COVID-19 pandemic? Please weigh in with your thoughts on this poll on your DTN Canada Home Page.
Cliff Jamieson can be reached at cliff.jamieson@dtn.com
Follow him on Twitter @Cliff Jamieson
© (c) Copyright 2020 DTN, LLC. All rights reserved.


Comments
To comment, please Log In or Join our Community .