Canada Markets
New-crop Canola Pushes Higher
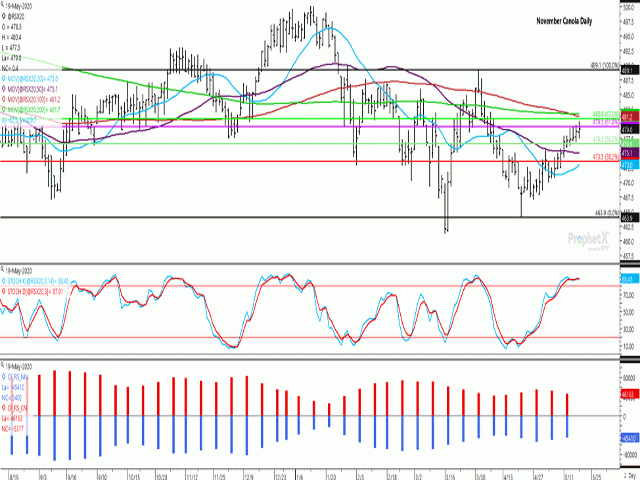
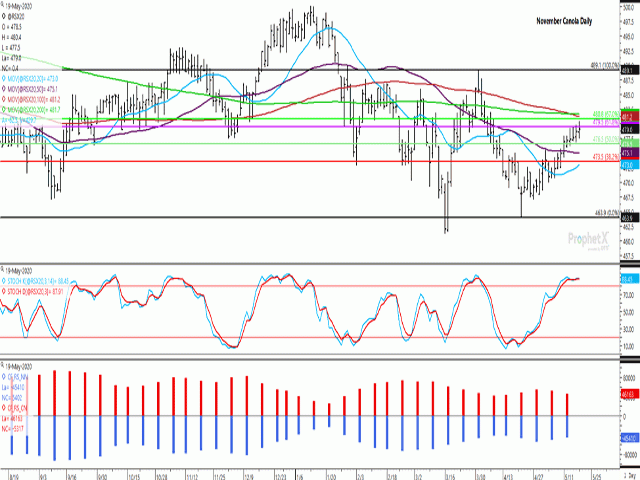
November canola closed higher for the 10th straight session, with a gain of $0.40/metric ton in May 19 trade. While old-crop July futures have struggled with recent highs, the new-crop contract continues to march higher, reaching a greater-high in eight of the past 10 sessions.
Since reaching the April 21 low of $463.90/mt, this contract price has gained $15.10/mt to Tuesday's close of $479/mt. Since the March 31 high, this chart shows a possibility of a "V" recovery, something that economists can only wish for the overall economy. Highs over the past two days have struggled with the 61.8% retracement of the move from the March high to April low, calculated at $479.50/mt. Should this level be cleared, the next level of resistance is seen at the 67% retracement at $480.80/mt. Further resistance lies at the 100-day moving average at $481.20/mt and the 200-day at $481.70/mt. Clearing these hurdles could lead to a further retracement of the March high at $489.10/mt.
P[L1] D[0x0] M[300x250] OOP[F] ADUNIT[] T[]
The middle study shows the stochastic momentum indicators in overbought territory on the daily chart, while the weekly chart (not shown) shows these indicators trending higher while near the middle of the neutral zone of the chart, signaling the potential for a continued move higher. What could be viewed as a concern on this chart is that the previous two crossovers of stochastic indicators on the weekly chart have taken place in the neutral zone of the chart. The most bullish of crossovers are seen taking place in the oversold region of the chart.
The blue bars of the lower study shows noncommercial traders paring their bearish net-short position over the past two weeks to a net-short position of 45,410 contracts, the smallest bearish position held in four weeks.
The red bars of the lower study signal that commercial traders are holding a bullish net-long position in canola. While this position has faced a decline over the past two weeks, this is not seen taking place in either soybean or soybean oil markets. May 12 CFTC data shows commercial traders holding the largest net-short position in soybeans seen in over two years.
Cliff Jamieson can be reached at cliff.jamieson@dtn.com
Follow him on Twitter @Cliff Jamieson
© (c) Copyright 2020 DTN, LLC. All rights reserved.


Comments
To comment, please Log In or Join our Community .