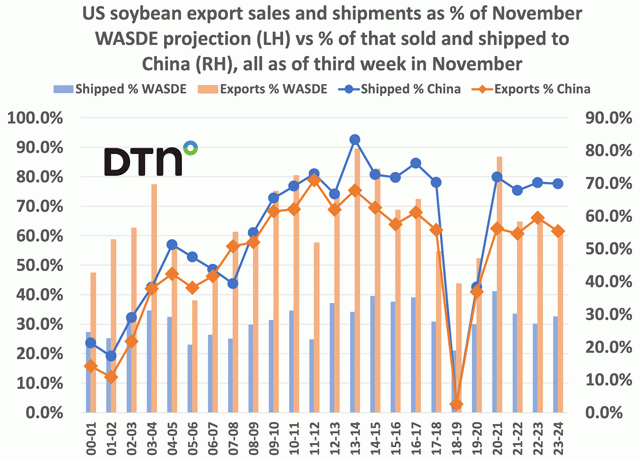
We have seen some fairly hefty Chinese buying over the past month as they hedge against a continuation of adverse Brazilian weather.

We have seen some fairly hefty Chinese buying over the past month as they hedge against a continuation of adverse Brazilian weather.
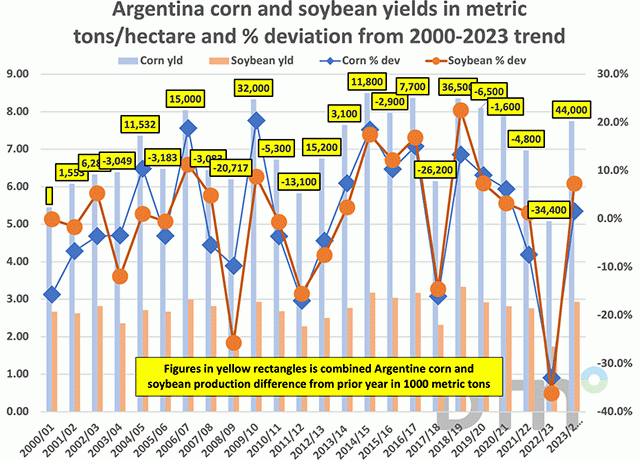
Brazil weather has had to share the spotlight over the past few days with Argentina's presidential election and its implications.
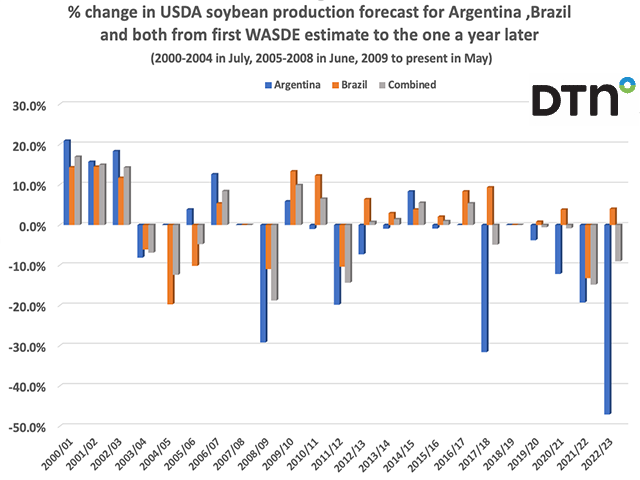
Argentina has had a string of bad luck as only twice since the 2006/07 season has the USDA increased its estimate of Argentine soybean production from its first WASDE projection to its estimate one year later.
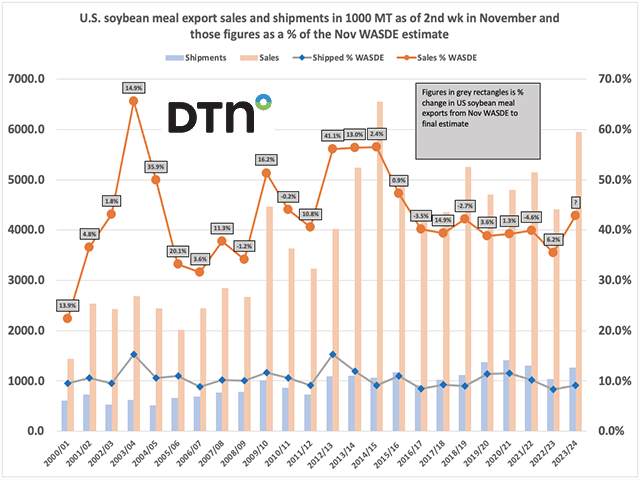
Many factors are contributing to the surge in contracts.
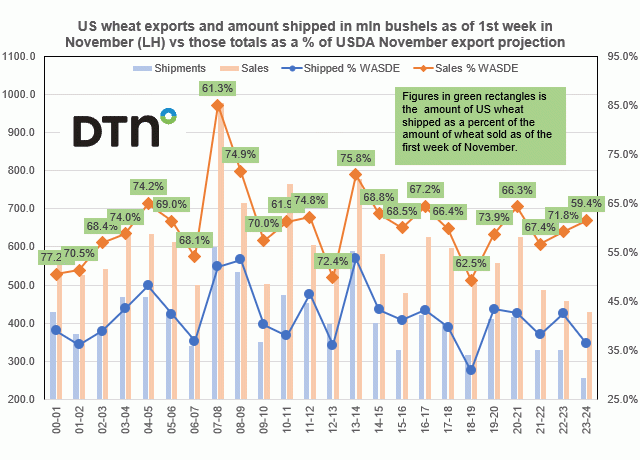
U.S. wheat export sales and shipments as of the first week of November vs. those figures as a percent of the USDA's November WASDE export projections
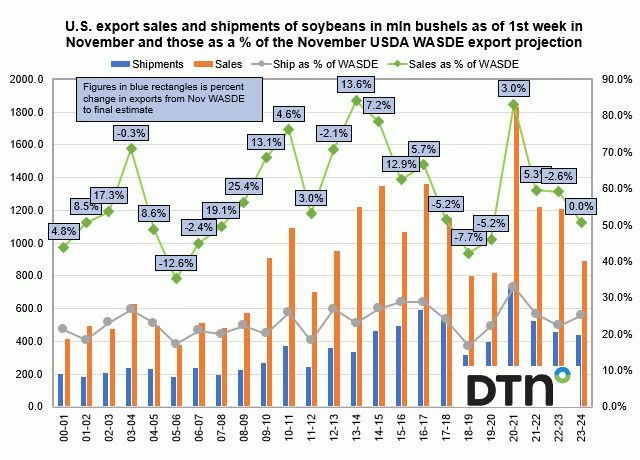
U.S. export sales and shipments of soybeans as of the first week of November vs. those figures as a percent of the USDA's November WASDE export projection
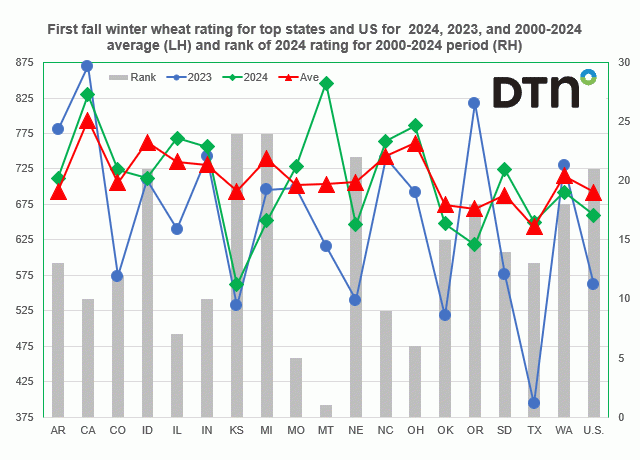
First fall winter wheat rating for the top 18 producing states and the U.S. for the both the 2024 and 2023 crops along with the 2000-2024 average vs. the rank of this year's initial winter wheat crop rating
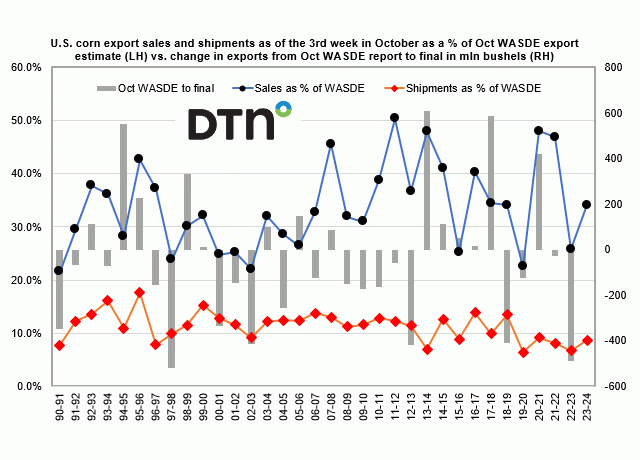
U.S. corn export sales and shipments as of the third week of October as a percent of the October WASDE export projection vs. the change in exports from USDA October WASDE projection to the final figure
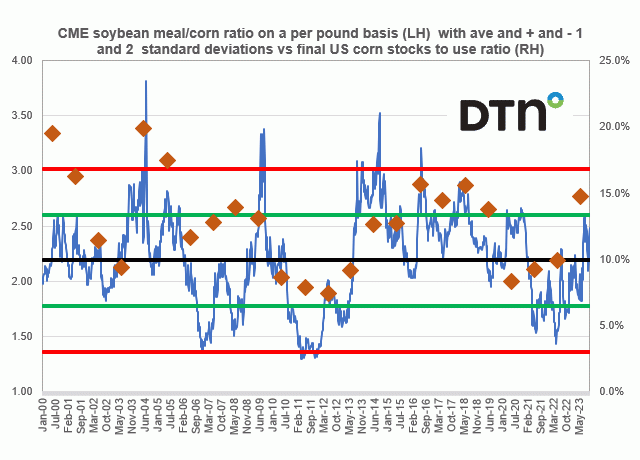
CME soybean meal/corn ratio, the average, and plus and minus one and two standard deviation lines plus final corn stocks-to-use ratio using data from 2000/01 to the current USDA 2023/24 projections.
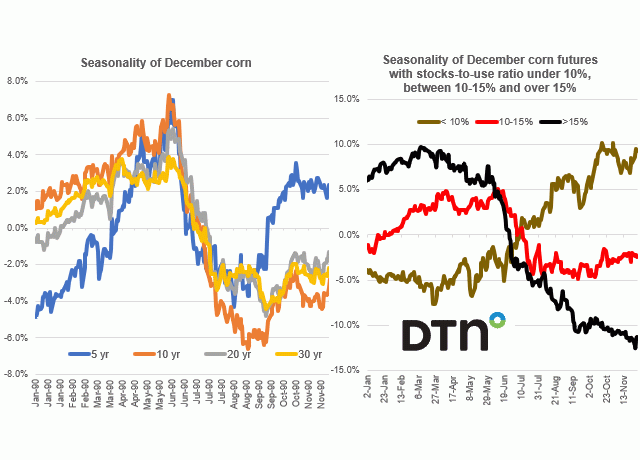
The 5, 10-, 20- and 30-year seasonality of December corn and seasonality of December corn futures for years when the stocks-to-use ratio is below 10%, those years when the stocks-to-use ratio is between 10 to 15% and then the years when the ratio is over 15%.
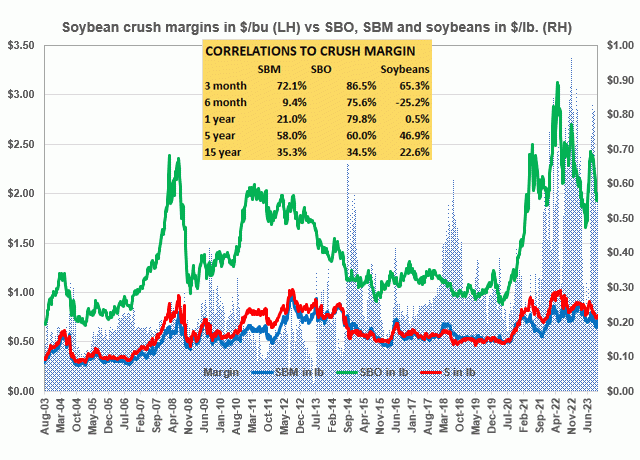
Weekly soybean crush margins vs. soybean, soybean meal and soybean oil prices
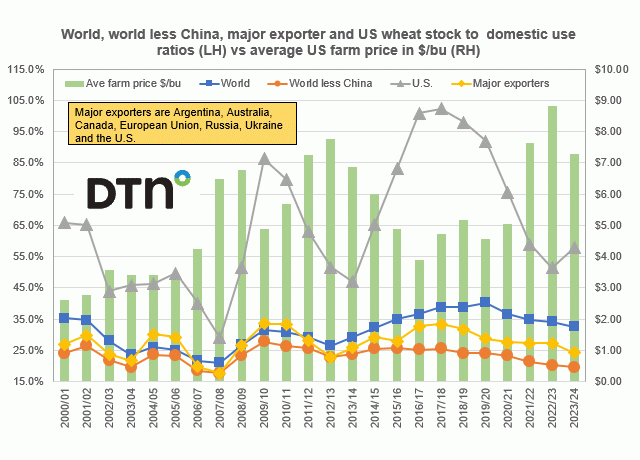
World, world less China, major exporters and U.S. wheat stocks-to-use ratios vs. the average U.S. farm price
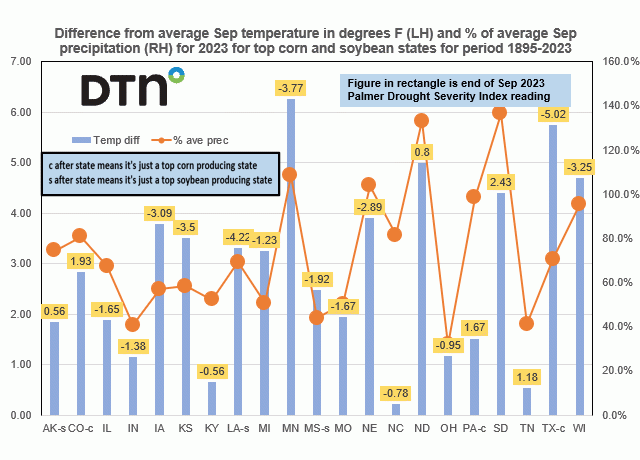
Difference from the average September temperature vs. the percent of average September precipitation
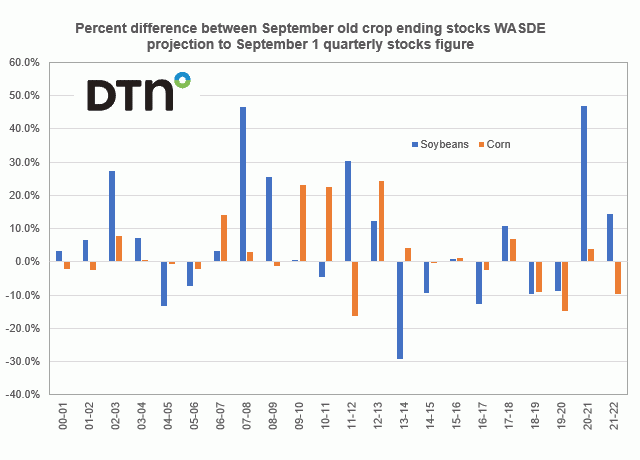
Percent difference between September old crop ending stocks WASDE projection to September 1 quarterly stocks figure
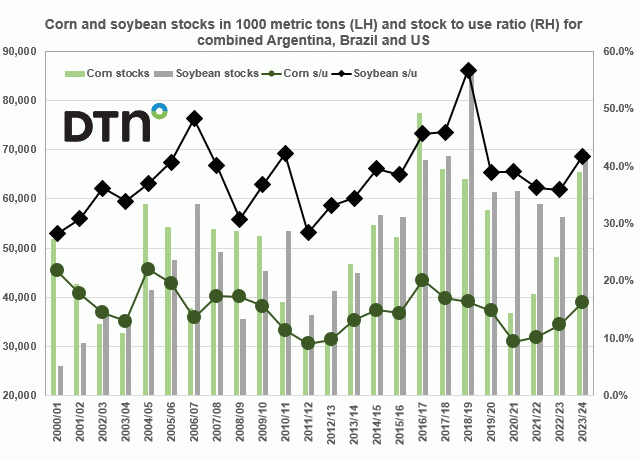
Corn and soybean stocks of the three largest producers combined vs. the aggregate stocks-to-use ratio
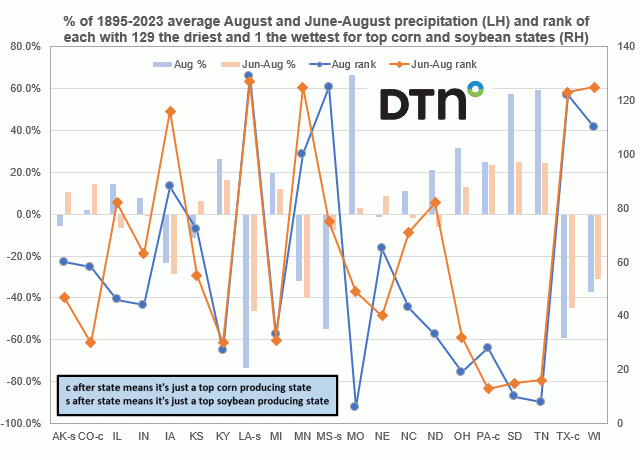
Percent of the 1895-2023 average August and total June through August precipitation for the top 21 corn and soybean producing states vs. the rank of where each state stands for both August and cumulative June-August precipitation
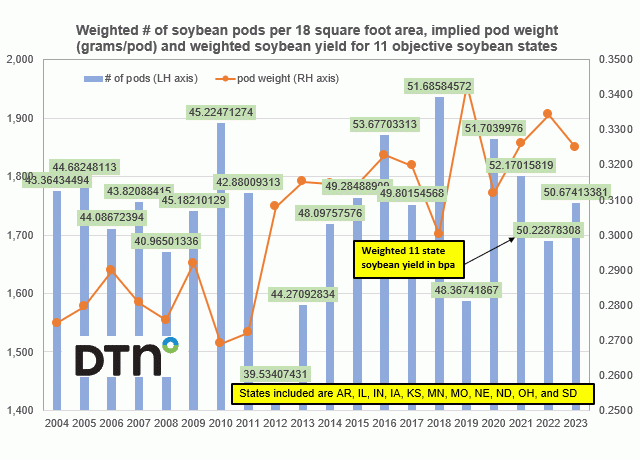
11-state objective number of soybean pods per 18 square foot area vs. the implied soybean pod weight in lbs./pod
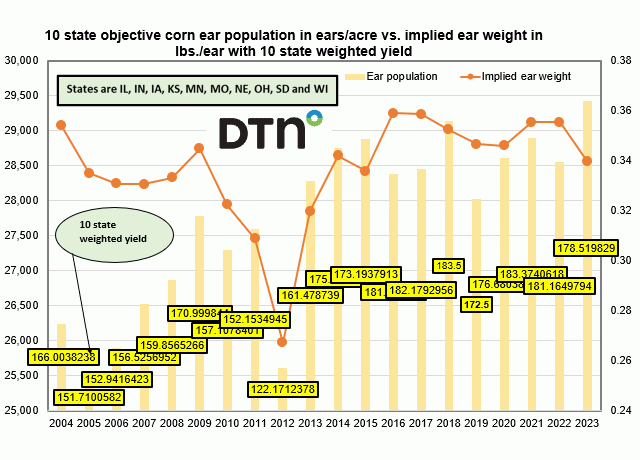
10-state objective corn ear population in ears/acre vs. the implied ear weight in lbs/ear
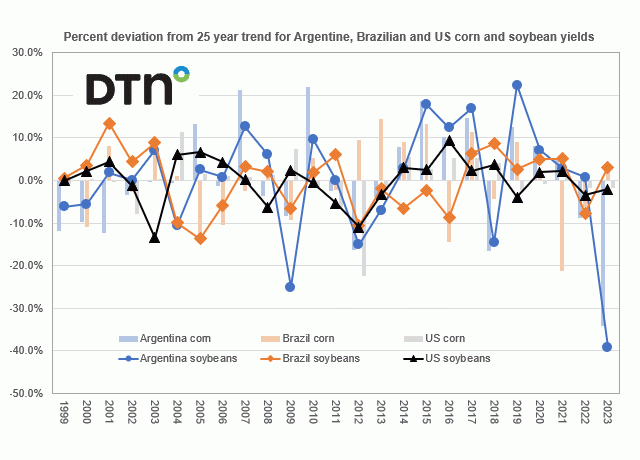
Percent deviation from the 25-year trend for Argentine, Brazilian and U.S. corn and soybean yields
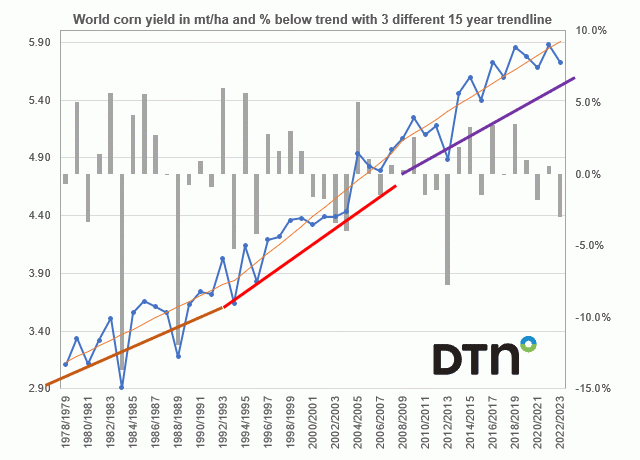
Actual yields from 1978-2022 and three separate trend lines (1978-1992 in orange, 1993-2007 in red and 2008-2044 in purple) vs. the percent that the actual yield deviates from their respective 15-year trend line
DIM[2x3] LBL[blogs-fundamentally-speaking-list] SEL[[data-native-ad-target=articleList]] IDX[2] TMPL[news] T[]
DIM[2x3] LBL[blogs-fundamentally-speaking-list-2] SEL[[data-native-ad-target=articleList]] IDX[5] TMPL[news] T[]