Fundamentally Speaking
A Look at China's Soybean Buying
We have seen some fairly hefty Chinese buying over the past month as they hedge against a continuation of adverse Brazilian weather. But these sales are not enough to boost the current pace of U.S. soybean export sales versus USDA projections.
USDA's WASDE report earlier this month kept 2023/24 U.S. soybean export projections at 1.755 billion bushels (bb) which is down 11.9% from the year ago figure of 1.992 bb. Yet, the latest export sales report has current exports at 1.068 bb, which is down 20.3% from the 1.339 bb sold at this time a year ago.
P[L1] D[0x0] M[300x250] OOP[F] ADUNIT[] T[]
Whether sales accelerate to attain the USDA projection is highly dependent on future Chinese buying, which will be linked to their soy crush margins, profitability in their swine and poultry sectors, the competitiveness of Brazilian export offers, and the robustness of their economy, among other factors.
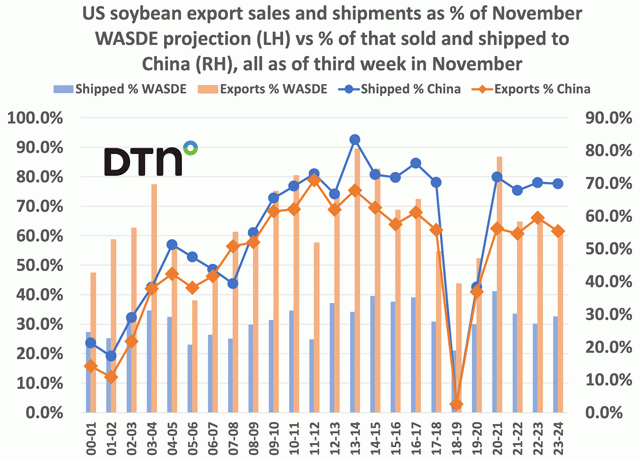
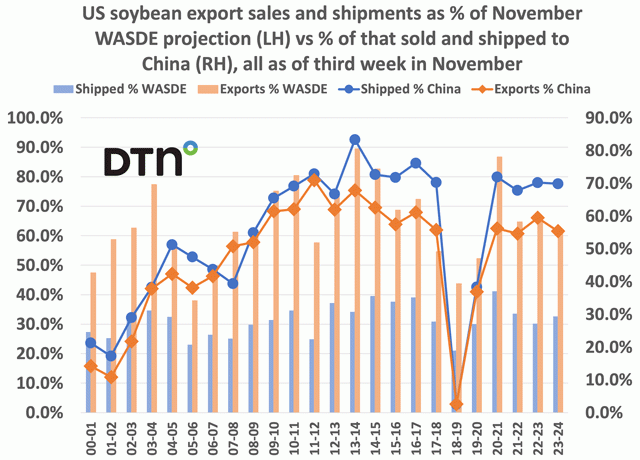
This accompanying chart shows, as of the third week of November, U.S. soybean export sales and shipments as a percent of the USDA November WASDE export projection on the left-hand axis versus the percent of that sold and shipped to China on the right-hand axis.
Current U.S. soybean sales of 1.068 bb are 60.8% of the latest USDA export projection and that is down from the year ago 65.5% figure and actually the fifth lowest figure since the 2006/07 season and below the 2000-2023 average of 64.3%.
The total shipped through the third week of November is 572.4 million bushels (mb) or 32.6% of the November WASDE export projection and is actually above the year ago figure of 30.8% and the long-term average of 31.4%.
Of the 1.068 bb sold, 591 mb is for the PRC, which is 55.4% of the total, down from 59.5% a year ago, though above the 2000-23 average of 47.4%. Of that total, 400 mb has been shipped to China, which is about 70% of the 572.4 mb, about the same as last year and well above the long-term average of 54.6%.
Looking at the data, it appears USDA's 1.755 bb projection may be close to the mark, though much will depend on how much more U.S. soybeans China will purchase over the final nine months of the 2023/24 marketing year, though sales to our largest customer have certainly increased from the low figures seen from 2018-2020 spurred by the trade wars persisting at that time.
(c) Copyright 2023 DTN, LLC. All rights reserved.


Comments
To comment, please Log In or Join our Community .