
Fundamentally Speaking
Record Slow Corn Planting Pace
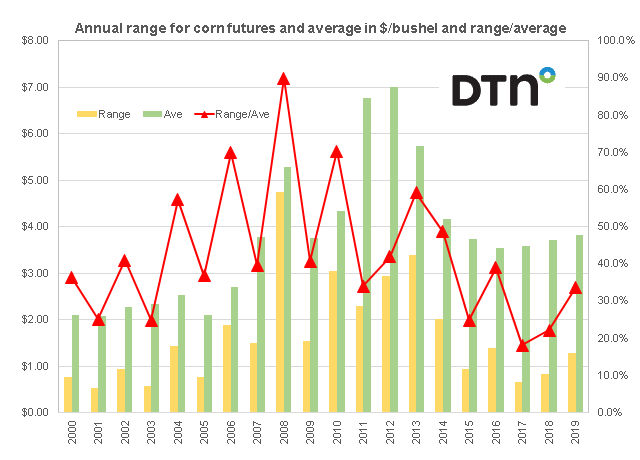
As we did with soybeans, this graphic shows the average spot corn futures price from 2000-2019 in dollars per bushel and the annual range measuring the price difference from the year's high to the year's low, also in dollars per bushel, on the left hand axis.
On the right hand axis is a very crude measure of volatility showing the annual range divided by the annual average.
P[L1] D[0x0] M[300x250] OOP[F] ADUNIT[] T[]
As opposed to soybeans where the average price for 2019 was the lowest average since 2007 and last year's range in soybean futures from the year's high to the year's low was the tightest annual range for the spot soybean futures since 2001, the average corn futures price last year was $3.83.
This is the highest since $4.15 in 2014 while the year's range was $1.29, the highest since 2016 and the second highest since 2014.
Last year's high was $4.64, the highest price since $5.20 was seen in the year 2014.
A look back shows that in a year of generally subdued price activity, record spring rains that resulted in the tardiest planting pace for corn ever sent spot corn futures rallying $1.23 from May 9 to June 17 before values then plunged $1.14 per bushel by September 9th.
We see the range over the average was 33.7%, also the highest since 2016 and the second highest since 2014.
(KLM)
© Copyright 2020 DTN/The Progressive Farmer. All rights reserved.

Comments
To comment, please Log In or Join our Community .