
Fundamentally Speaking
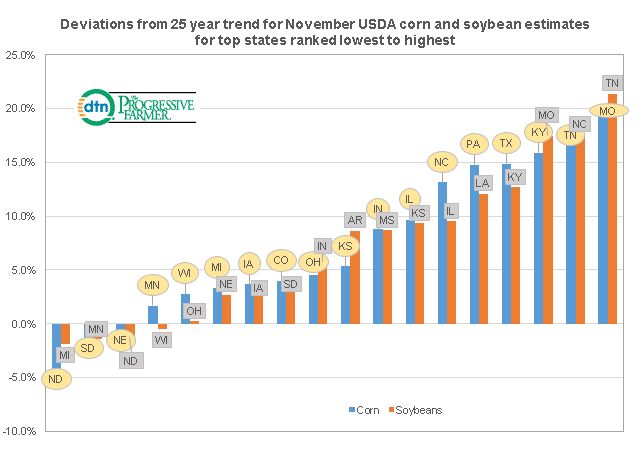
Trend Deviations for Top Corn & Bean States

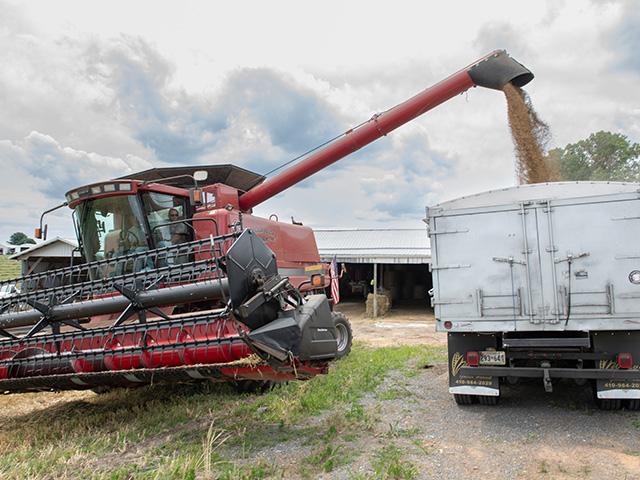
The final tally for 2017 U.S. corn and soybean yields will be unveiled next month in the annual crop production report but the November figures revealed a record national corn yield of 175.4 bushels per acre (bpa) and the second highest soybean yield at 49.5 bpa vs. the prior peak a year ago at 52.0 bpa.
Needless to say, a number of states saw record high yields, well above their respective trend calculations.
This graphic ranks the top 18 producing states of each crop from low to high in terms of deviation from the 25-year trend calculation.
P[L1] D[0x0] M[300x250] OOP[F] ADUNIT[] T[]
The Northern Plains and the Upper Midwest had some challenging weather this year especially from extended dryness.
This is reflected in corn and soybean yields that were actually below trend in such states as North and South Dakota, Minnesota, Michigan and Wisconsin.
The paucity of precipitation was most pronounced the second half of the summer and affected soybeans more than corn.
On the other hand, states such as Tennessee, Kentucky, Missouri and North Carolina had a good mix of sunshine and moisture to produce row crop yields that were often 15% or more above trend.
Expectations for the final crop report in January are mixed, though with the USDA having hiked its national corn yield in the September, October and now November reports, there is a strong likelihood that this trend will continue in the final report.
There is more uncertainty about the fate of the final soybean yield given less advantageous growing conditions and the fact that yields were lowered from the September into the October report, though the yield was unchanged in the November report.
(KA)
Comments
To comment, please Log In or Join our Community .