

Fundamentally Speaking
Lowest Corn, Soybean Ranges

Putting the closing touches on a very desultory year as far as corn and soybean prices go, this piece focus on the very quiet trade seen in 2017.
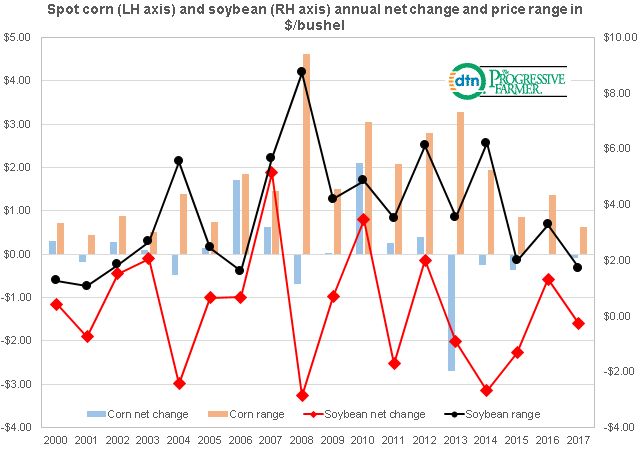
This graphic shows the yearly range and net change for spot corn prices on the left hand axis and soybean values on the right hand axis annually since 2000.
Large global and domestic stockpiles along with generally tranquil weather kept action in corn futures this past year quite muted.
Spot corn started the year out at $3.56 per bushel and as of December 18th we are trading at $3.47, a mere nine cent change.
Other than a little weather inspired rally in early summer there was absolutely no volatility in values whatsoever as the difference between the high and low of the year was a mere 63 cents as this is the narrowest trading range in corn futures since 2003 and the third lowest since 2000.
As for soybeans, similar to corn action trading was quite subdued as the net price change from the start of the year till December 18th is a mere 28 cent decline vs. the $1.32 per bushel gain last year.
Meanwhile the range from the low of the year to the high was $1.71 per bushel, the lowest spread since a $1.61 range was seen in 2006 and before that $1.07 back in 2001.
We have heard a lot this year about how the lack of any real fundamental story has contributed to a distinct lack of price volatility, which has hurt the economic fortunes of a number of global trading companies and this chart offers further proof.
(KA)
P[L1] D[0x0] M[300x250] OOP[F] ADUNIT[] T[]
Comments
To comment, please Log In or Join our Community .