

Fundamentally Speaking
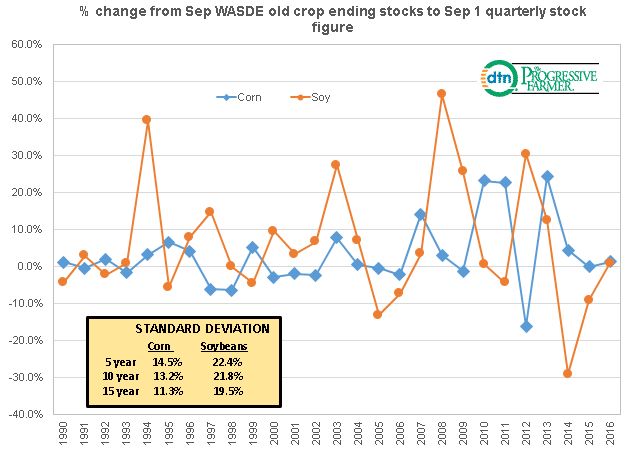
% Change From Sep WASDE to Quarterly Stocks

The USDA will release The September 1 stocks report on the 29th and the trade estimates for corn stocks is 2.346 billion bushels and that for soybeans at 339 million bushels.
Note these are very close to the last 2016/17 ending stocks given in the September WASDE report at 2.350 billion bushels for corn and 345 million bushels for soybeans.
Given that most of the demand information has already been released it is not surprising that often the September WASDE old crop ending stock estimates are very close to the September 1 quarterly stock figures.
P[L1] D[0x0] M[300x250] OOP[F] ADUNIT[] T[]
However with August Census Bureau soybean and corn grind figures still not known along with questions as to final export demand there have been cases where the Sep 1 stocks is very different from the old stock figures given in the September WASDE especially if the old crop production number was either over or understated.
The accompanying graphic shows the percent change in the September WASDE old crop ending stock estimates for both corn and soybeans to the September 1st quarterly stocks figures.
Actually in recent years we have seen some wide divergence with the September 1, 2008 soybean stocks coming in 65 million bushels or a whopping 46.5% higher than the Sep 2008 WASDE estimate whereas the Sep 2014 soybean stock figure was 38 million or 29.4% below the Sep 2014 WASDE soybean ending stocks number.
Similarly in corn we had a large negative differential in September 2012 and a large positive differential a year later.
Recently there has been a lot of controversy on why and how the government quarterly stock estimates vary widely from trade estimates.
Reasons expounded include increased farm storage as a percent of total on and off farm storage, less truthful or incomplete responses from farmers and perhaps some new crop stocks that are mistakenly counted as old crop supplies.
As a final point, note how the standard deviation of the differences has increased in recent years compared to past history for both corn and soybeans.
(KA)
© Copyright 2017 DTN/The Progressive Farmer. All rights reserved.
Comments
To comment, please Log In or Join our Community .