
Fundamentally Speaking
End of July Corn Crop Conditions in Top States

2016 saw U.S. corn yields at a record 174.1 bushels per acre based on generally good to excellent growing conditions in many of the top 18 growing states.
This has not been the case this year as a severe drought that started in the Northern Plains has migrated south and east over the past few weeks, impacting the rest of the Plains and much of the Western Corn Belt.
P[L1] D[0x0] M[300x250] OOP[F] ADUNIT[] T[]
This is reflected in an examination of weekly crop conditions as measured by the USDA as of the end of July.
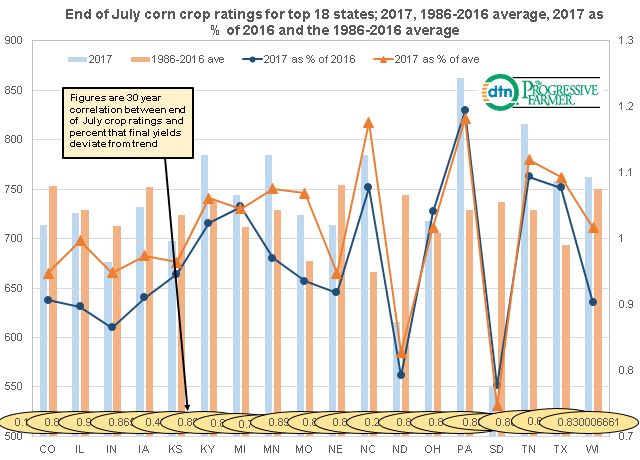
Using our usual ratings system where we weight the crop based on the percent in each category and assign that category a factor (2 for very poor, 4 for poor, 6 for fair, 8 for good, and 10 for excellent) and then sum the results, we look at end of July crop ratings for this year, the 1986-2016 average and then calculate 2017 ratings vs. 2016 ratings and vs. the 1986-2016 average.
At the bottom along the x-axis we also show the correlation between end of July crop ratings and how each state final yield deviated from the 30 year trend for the period 1986-2016. South Dakota, the epicenter of the current drought has the worst crop rating this year at 550 and that is 22% below year ago levels and 75% of the 1986-2016 average.
North Dakota is next lowest with a rating of 616, which is 21% below 2016 and 17% off from the 30-year average. On the other hand, states such as Pennsylvania and North Carolina are doing exceptionally well.
We also note that states such as Illinois, Indiana, Iowa, and Missouri have very high correlations between end of July crop conditions and the percent that final yields deviate from trend.
(KA)
Comments
To comment, please Log In or Join our Community .