

Fundamentally Speaking
Insights From July Spring Wheat Yield Estimates?
Last week the USDA in its first projection of the U.S. spring wheat crop pegged the yield at 40.3 bushels per acre (bpa).
This would be the lowest other spring wheat yield since 2011 and prior to that 2007 and would be the lowest July estimate since 2009.
This 40.3 bpa yield is 10.4% below the calculated 2017 trend yield of 45.0 bpa.
Given the ongoing drought in the states of North Dakota, South Dakota and Montana where the bulk of this crop is grown additional yield declines are expected in both the August and September crop production reports.
P[L1] D[0x0] M[300x250] OOP[F] ADUNIT[] T[]
Note that the first USDA yield estimate for spring wheat comes in July, one month prior to the first USDA field survey based production reports for both corn and soybeans.
We were curious if the spring wheat yield estimate could give any insights as to what yields would be when the USDA releases its first field survey based production report for corn and soybeans in the August report.
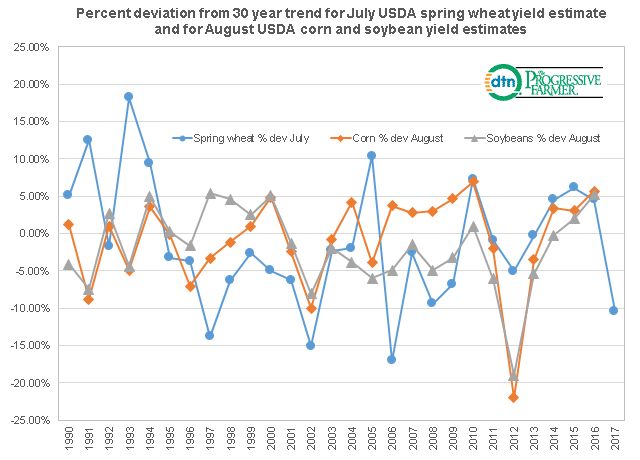
This piece shows the percent deviation from the 30-year trend for the July USDA spring wheat yield estimate and also the percent deviation from the 30 year trend for the August USDA corn and soybean yield estimates.
Unfortunately there appears to be little if any relation between deviations from trend for spring wheat yields vs. percent deviations from trend for corn and soybeans with the correlation between percent deviations from trend between spring wheat and corn at 6.3% and that for soybeans at 4.2%.
One reason is that each crop is grown in different areas with corn and soybeans to some extent seeing output come primarily from the Midwest while spring wheat production is centered in the Northern Plains.
The critical month for spring wheat appears to be June, whereas it is July for corn and August for soybeans. Since 1990 there have been four seasons where the July spring wheat yield estimate was 10% below trend starting in 1997 at off 13.8% yet the August corn and bean projections were 3.3% below trend and 5.4% above trend respectively.
In 2002 there was some overlap with spring wheat yields off 15.1% with corn down 10.0% and soybeans off 8.1%.
The other year besides 2017 when spring wheat yields were more than 10% below trend was in 2006 at 17.0% below trend yet the August corn yield estimate that year was 3.7% above trend with beans off 4.9%.
(KA)

Comments
To comment, please Log In or Join our Community .