

Canada Markets
What a Difference a Week Makes in the Markets

The summer weather market came early last week, with the weekly U.S. Drought Monitor signaling expanding drought during the most recent week. The USDA has signaled that the row crop area affected by drought has increased for a fourth consecutive week, jumping by 12 percentage points for both corn and soybeans over the last week, the largest weekly increase over the four weeks. The most recent estimates as of June 13 shows 57% of corn acres and 51% of soybean acres are experiencing some degree of drought. This estimate drops to just 4% of spring wheat acres experiencing drought, which has fallen for three consecutive weeks, along with 50% of winter wheat acres, which has increased for two consecutive weeks.
While the markets have been slowly responding over time, market action over the week ending June 16 sent a clear signal of growing fear and the dangers of remaining short as weather uncertainty grows, with the seven-day forecast continuing to signal a lack of precipitation for areas of the eastern Midwest.
DTN Lead Analyst Todd Hultman has summed up this move over time in his most recent Todd's Take titled "From Bearish to Bullish, Corn Prices Scramble To Adjust," at https://www.dtnpf.com/….
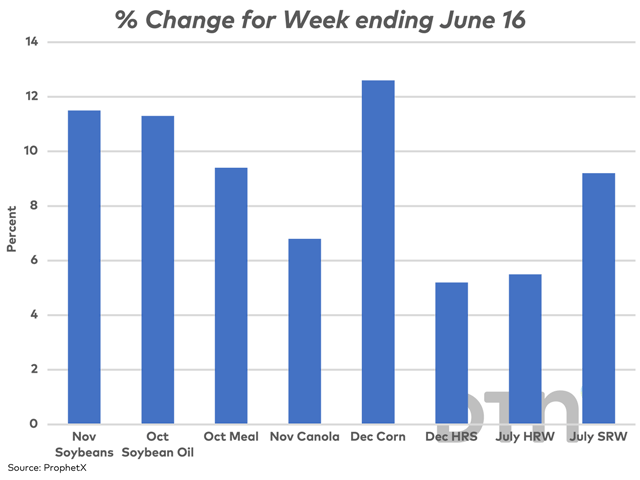
The attached chart highlights the percentage change in price seen across various crop and product futures for the week ending June 16. Of those shown, the December corn contract led the way with a 12.6% gain while November soybeans followed with an 11.5% gain. Canola futures moved higher along with the soy complex, with a more modest 6.8% rally.
P[L1] D[0x0] M[300x250] OOP[F] ADUNIT[] T[]
The following are market signals seen during the past week which bears watching, while considering a change in forecast can change everything.
December corn breached its 100-day moving average on June 15, while breaching its 200-day moving average at $5.84/bushel on June 16, coming within 2 cents from testing psychological resistance at $6/bu. This is the first close above the 200-day since Nov. 18. It is interesting to note that CFTC data for the week ending June 13, before the large moves at the end of the week, shows noncommercial traders moving from a bearish net-short to a bullish net-long futures position, while for the first time in seven weeks. The Dec/March futures spread closed at minus 6 1/2 cents, a level not seen since mid-October.
November soybeans breached the resistance of the contract's 100- and 200-day moving average on the same day, or June 16. This is the first close above the 200-day since March 8, or more than three months. Noncommercial traders increased their bullish net-long position for a third consecutive week in the week ending June 13, now holding the largest bullish position in five weeks after recently reaching the smallest bullish position held since November 2021. The Nov/Jan futures spread has narrowed to minus 4 3/4 cents, the narrowest spread seen since March 17.
Soybean oil for October breached its 100- and 200-day moving average over June 15-16, while CFTC data shows noncommercial traders moving from a bearish net-short position to a bullish net-long position for the first time in 13 weeks. October soymeal closed above its 50-day moving average for the first time since April, with its 100-day moving average in sight. Noncommercial traders continue to hold a significant net-long position, which increased by a modest 119 contracts over the most recent week.
November canola gained a significant $45.50/metric ton or $1/bushel over the week ending June 16, failing to sustain a move above its 100-day moving average. Noncommercial short-covering clearly played a role late in the week, although it is important to note that over the week ending June 13, noncommercial traders have increased their bearish net-short position for a fourth consecutive week, now holding the largest bearish position held in 12 weeks. This market is poised for a sudden rebound should conditions suddenly turn bullish.
Wheat traders have shown restraint, as seen by the lower percent gains seen over the past week. The market to watch is the Chicago soft red winter wheat market, which gained 9.2% over the week. The weekly close was just 1/4 cent under the contract's 100-day moving average, falling just shy of the first close above the 100-day since Nov. 7, 2022. As of the week ending May 30, noncommercial traders held the largest net-short position seen since January 2018, or over 5.5 years. While this position has been pared modestly over the past two weeks, the bearish net short as of June 13 is still the fourth largest over this period and like canola, remains poised for a sudden change in direction should wheat traders face a growing change in sentiment.
December hard red spring wheat gained just 5.2% over the past week, the smallest weekly gain seen on the attached chart. Despite the small percentage gain, the December contract settled above its 50-day moving average on June 15 and above its 100-day moving average on June 16. This was the contract's first close above the 100-day in one month. Noncommercial traders remain net-short for a seventh consecutive week.
Cliff Jamieson can be reached at cliff.jamieson@dtn.com
Follow him on Twitter @Cliff Jamieson
(c) Copyright 2023 DTN, LLC. All rights reserved.
Comments
To comment, please Log In or Join our Community .