

Canada Markets
2022-23 Crop Year Supplies Based on Current Government Forecasts
There are a number of reasons to challenge the Aug. 29 release of Statistics Canada's first production estimates for the year. The lag in the data release has been challenged in recent media pieces quoting industry representatives, with this week's report based on July model-based data, which has missed key weather events during the past month.
Some stories in the media pointed to the large, expected recovery in Canada's output, especially at a time when global supplies are tight and shipments out of the Black Sea region are curtailed. To coin the federal government slogan, "Canada is back," following the sharply reduced crop output achieved in 2021-22.
Some people gave their opinions on social media, including one Twitter user who mentioned the 30 bushel-per-acre average lentil yield forecast released by Statistics Canada this week -- and indicated that there will need to be a number of 40-bpa-or-higher crops harvested to offset the under-20-bpa crops being harvested. Crop variability was seen from north to south in some provinces, from east to west across the Prairies as well as within individual communities based on who received rain and who didn't, perhaps making this week's estimates hard to swallow for many.
P[L1] D[0x0] M[300x250] OOP[F] ADUNIT[] T[]
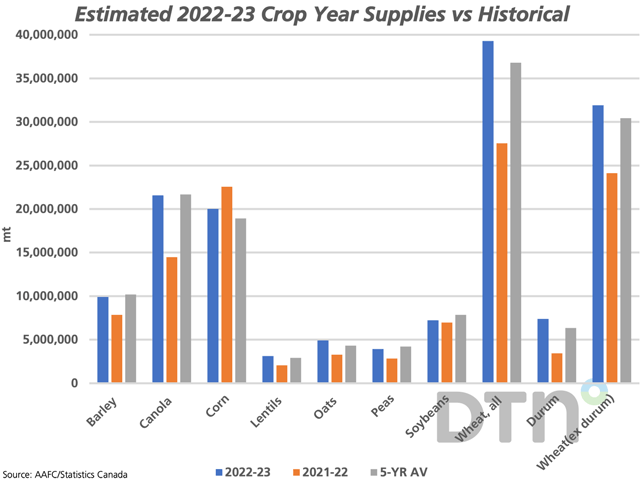
When Monday's Statistics Canada estimates along with the prior-year adjustments included in the report are combined with Agriculture and Agri-Food Canada's current forecasts which includes 2021-22 ending stocks along with estimated imports for 2022-23, we arrive at crop year supplies which are indicated by the blue bars on the attached chart.
When compared to the five-year average, supplies of barley (minus 2.7%) canola (minus 0.6%), peas (minus 6.6%) and soybeans (minus 8%) will be lower than their respective five-year average (grey bars), with the percent change shown in brackets.
Estimated supplies of wheat (excluding durum), for 2022-23 are estimated to increase by 4.9%, corn (5.8%), lentils (7.2%), oats (13.5%) and durum (16%), with the percent change from the five-year average on brackets.
Watch for a follow-up report to be released by Statistics Canada on Sept. 14, while the feedback from the field over the weeks ahead may be what really counts. Statistics Canada will also release July 31 stocks estimates on Sept. 7.
Cliff Jamieson can be reached at cliff.jamieson@dtn.com
Follow him on Twitter @Cliff Jamieson
(c) Copyright 2022 DTN, LLC. All rights reserved.

Comments
To comment, please Log In or Join our Community .