

Canada Markets
A Look at Historic National Yields for Select Crops
Statistics Canada will release its first official crop production estimate for the 2022-23 season on Aug. 29. For a third consecutive year, production will be derived from model-based analysis of July conditions, while this report will be followed by Sept. 14 model-based estimates to be released, derived from August conditions.
While the two reports are roughly two weeks apart, the change in conditions from July to August can lead to large swings in results. In 2020, the estimated barley yield in the September report was revised 2.6 bushels per acre (bpa) lower while the wheat yield (including winter wheat) was down 2.4 bpa. The canola yield was unchanged, while the oat yield was 0.1 bpa higher.
P[L1] D[0x0] M[300x250] OOP[F] ADUNIT[] T[]
In 2021, the persistent heat and drought that carried into August saw all yields reported lower in the September report, including a 11.4 bpa drop in oats, 4.3 bpa in barley, 3.9 bpa for canola and 2 bpa for wheat.
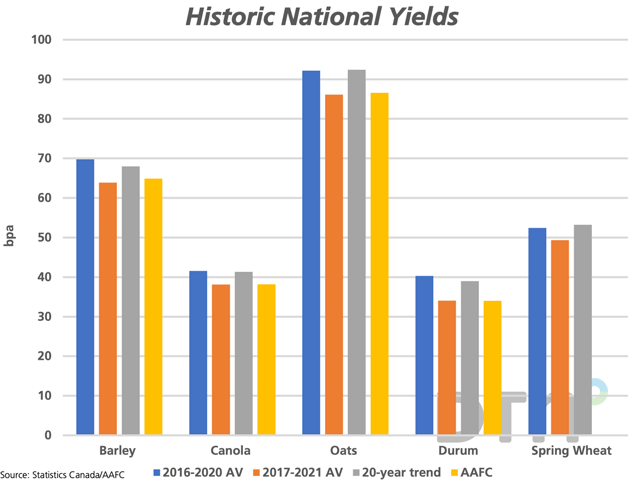
The attached chart compares Agriculture and Agri-Food Canada's unofficial yield estimates for 2022 for select crops except for spring wheat, as its wheat yield includes both spring and winter wheat. This is shown by the yellow bars. These results tend to be in line with the 2017-21 five-year average, which includes the effects of the drought-reduced yield in 2021.
Perhaps a more reasonable benchmark is the 2016-20 five-year average, which excludes 2021 data. This is shown by the blue bars; across the crops shown, this average ranges from 3.1 bpa higher for spring wheat to 6.2 bpa higher for durum.
The grey bar represents the 20-year trend for these crops, which ranges from 1.8 bpa lower than the 2016-20 average for barley to 0.8 bpa higher for wheat.
Cliff Jamieson can be reached at cliff.jamieson@dtn.com
Follow him on Twitter @Cliff Jamieson
(c) Copyright 2022 DTN, LLC. All rights reserved.

Comments
To comment, please Log In or Join our Community .