

Canada Markets
A Look at USDA's Rapeseed/Canola Forecast

The USDA's Oilseed: World Markets and Trade for August rapeseed includes a forecast global rapeseed/canola production of a record 82.480 million metric tons, up 10.169 mmt from the previous crop year, which is the largest year-over-year change in their global production forecast going back to 1965/66. This would be only the second year-over-year increase in production in five years.
The USDA's forecast for Canada shows a 7.4 mmt increase in production to 20 mmt for 2022, accounting for 73% of the entire global increase. This exceeds the unofficial AAFC forecast of 18.4 mmt released in July, while the first official estimates will be released on August 29.
Global consumption is to rise for the fourth consecutive year to a record 79.178 mmt, while the year-over-year increase of 5.102 mmt is the largest year-over-year change reported in 14 years.
P[L1] D[0x0] M[300x250] OOP[F] ADUNIT[] T[]
When the estimate for global production is compared to global demand, production exceeds demand by 3.302 mmt, the first time in four years that production exceeds demand, while by the largest amount in five years.
As a result, global stocks are forecast to rise by 2.187 mmt or 47.3% to 6.811 mmt, which is down roughly 583,000 mt from the five-year average.
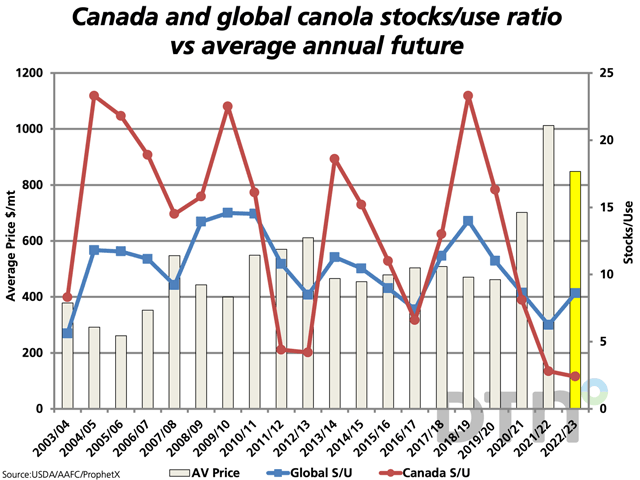
As seen on the blue line on the attached chart, the global stocks/use ratio is forecast to increase by 2.4 points to 8.6%, the first year-over-year increase seen in four years, while the current AAFC forecast points to an expected drop in Canadian stocks/use of 2.4%, a fourth consecutive annual drop. This is shown by the divergence in the blue line (global s/u) and the red line (Canadian s/u) on the attached chart.
The bars on the attached chart represent the average close on the continuous active chart for each crop year, with this average reaching a high of $1,012.61/mt in 2021-22, while early in 2022-23 (yellow bar), this average is $848.63/mt.
As indicated, the first official estimates of Canada's production potential will be released in late August, while it will be feedback from the combines in the field that will matter most.
Cliff Jamieson can be reached at cliff.jamieson@dtn.com
Follow Cliff Jamieson on Twitter @Cliff Jamieson
(c) Copyright 2022 DTN, LLC. All rights reserved.
Comments
To comment, please Log In or Join our Community .