

Canada Markets
December HRS Changes Direction
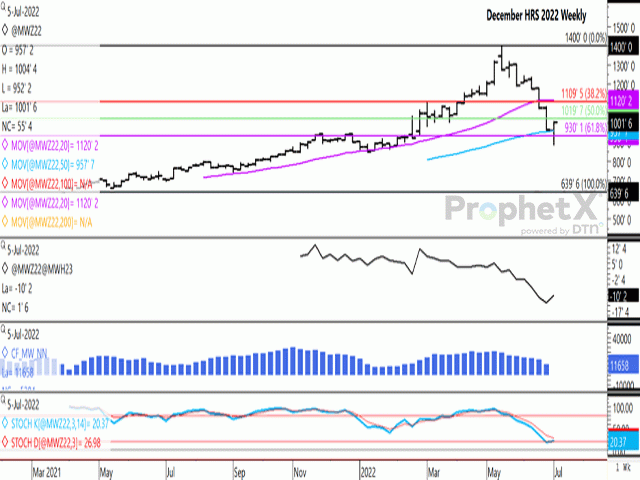
Over the previous three weeks, the December MGEX contract fell by $2.57 1/4/bushel, while noncommercial traders pared their bullish net-long position for eight consecutive weeks.
Trade for the week of July 5 shows the first weekly gain in four weeks, closing 41 1/4 cents higher at $10.03 1/2/bu. Support was found at the 61.8% retracement of the move from the contract's low to the contract high of $14/bu reached in May, calculated at $9.30/bu, while price traded as low as $8.86/bu only to close above $10/bu, perhaps signaling psychological support at the $9 and $10/bu levels.
This week's move was achieved with extremely high volume of contracts traded, with 23,515 contracts reported for the December contract over the week, which compares to 19,158 contracts traded in the previous week when the price fell by $1.14/bu, while the previous three-week average is 12,825 contracts, with a lower close realized for each week.
P[L1] D[0x0] M[300x250] OOP[F] ADUNIT[] T[]
The first study on the attached chart shows the December 22/March 23 spread strength or narrowing 3 3/4 cents over the week to end at minus 10 cents, signaling the likelihood of supportive commercial activity in the market. This time last year, this spread traded at a 7 1/4 cent inverse while trading in a range from minus 12 3/4 cents to minus 15 cents on this day over the three years prior. This spread has averaged minus 6 3/4 cents over the past three years, while averaging minus 4 3/4 cents over the past five years.
The blue bars on the histogram in the second study show the noncommercial net-long position reaching a recent high of 25,093 contracts on the week of May 9, while has fallen for eight consecutive weeks since, the last of which was not included on this chart. In the most recent week ending July 5, this noncommercial net-long position fell by 1,315 contracts to 7,943 contracts. This is the smallest bullish position held since April 5, 2021, despite a late North American spring wheat crop and the Russia-Ukraine war raging on.
While not shown, the daily chart shows a recovery in July 8 trade to close above the contract's 200-day moving average, calculated at $9.93/bu, while December soft red winter wheat and December hard red winter wheat made a similar move this session.
The lower study shows the stochastic momentum indicators for the weekly chart. They have yet to cross, which would signal a change in direction, while the most bullish of market turns are seen when this cross-over of indicators takes place in over-sold territory, or below 20 on the chart. This bears watching.
Cliff Jamieson can be reached at cliff.jamieson@dtn.com
Follow him on Twitter @CliffJamieson
(c) Copyright 2022 DTN, LLC. All rights reserved.

Comments
To comment, please Log In or Join our Community .