Canada Markets
Canola Crush on a Brisk Pace Despite Tight Supplies
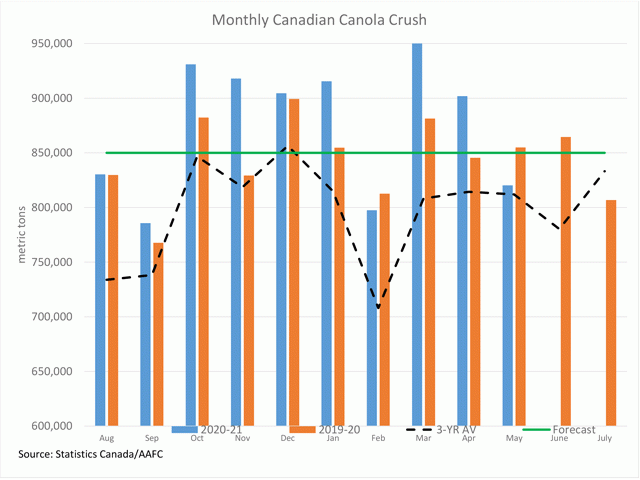
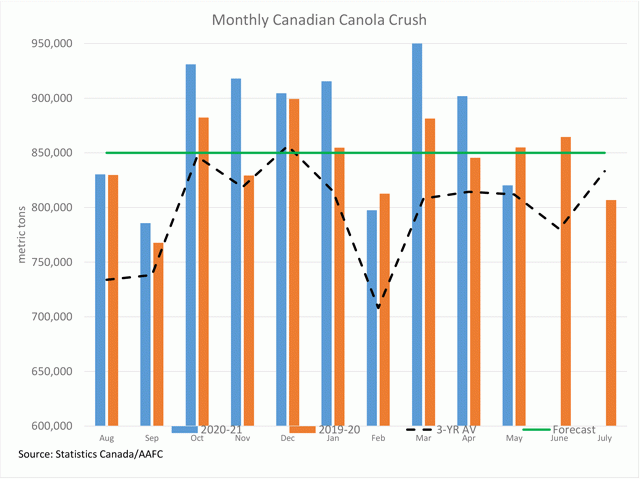
Statistics Canada data shows the canola crush increasing for a second month in October to 876,127 metric tons, the highest monthly crush in six months. While this is down 5.9% from the same month in 2020, when the second highest crush ever of 931,060 mt was achieved, the October crush is up 7.4% from the three-year average for this month.
During the first three months of the crop year, 2.316497 million metric tons (mmt) of canola has been crushed, down 9.1% from the same period of 2020-21 but 1.1% higher than the three-year average. This is achieved on a year with production estimated at 12.8 mmt, down 36.2% from the three-year average, while crop year supplies are currently estimated at 14.699 mmt, down 38% from the three-year average. Agriculture and Agri-Food Canada's November demand estimates show 2021-22 crush forecast at 8.5 mmt, revised 1 mmt higher this month, which is down 18.3% from the 2020-21 crop year. The current pace of activity is well ahead of the forecast pace.
Not only is the pace of crush lower, but the oil content in the seed is well-below average. The monthly calculation points to the October oil content at 41.1%. This is the lowest monthly percentage reported since August 2005, while compares to the 2019-20 average of 43.4% and the three-year average is 43.6%. Current results are reported below the Canadian Grain Commission's harvest sample data, with the most recent Nov. 23 report showing the mean oil content for Western Canada No. 1 at 42%. Given the current 8.5 mmt crush estimate, each 1% in oil content represents 85,000 mt of crude canola oil.
P[L1] D[0x0] M[300x250] OOP[F] ADUNIT[] T[]
We have previously discussed the massive shift in forecast demand from exports to crush, with AAFC's November estimates revising export demand 1 mmt lower while revising crush demand 1 mmt higher. In January 2021, the initial release of 2021-22 forecasts by AAFC, exports were estimated at 10.4 mmt while crush was estimated at 9.5 mmt. By August, the first month of the current crop year, the demand forecast shows 7 mmt of exports, 8 mmt of crush. After the November revisions, this is shown at 5.5 mmt of exports and 8.5 mmt of crush.
If we look at historic Statistics Canada data, we see that the total crush and total export volumes are reported at levels that are within 100,000 mt over the past three years, with crush slightly higher than exports in two of the past three crop years (2018-19 through 2020-2021). For the 20 years prior to this period, exports have exceeded crush in every year (1998-99 through 2017-18). Exports were as much as 3.628 mmt higher than crush in 2008-09, while averaging 1.4 mmt higher during this 20-year period.
**
DTN 360 Poll
This week's poll, found on the lower-right side of your DTN Home Page, asks if you will consider pricing new-crop production? We value your opinion and thank you in advance for your response.
Cliff Jamieson can be reached at cliff.jamieson@dtn.com
Follow him on Twitter @Cliff Jamieson
(c) Copyright 2021 DTN, LLC. All rights reserved.


Comments
To comment, please Log In or Join our Community .