Canada Markets
Week 11 Western Terminal Stocks above Average
Despite this year's smaller prairie crop, an early harvest and favourable rail movement has led to western terminal stocks of grain (Vancouver, Prince Rupert, Churchill and Thunder Bay) that are 5% higher than the same week in 2020-21 as of week 11, or the week ending Oct. 17, while 11% higher than the three-year average for this week. Stocks of 1.5027 million metric tons represent 54.3% of total capacity while 77.6% of the estimated working capacity of these terminals.
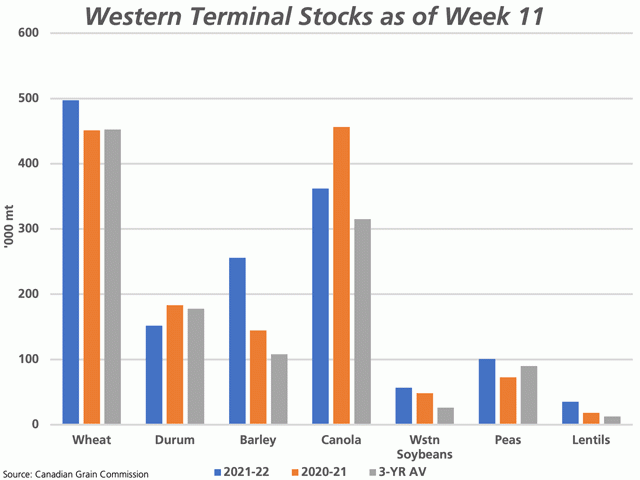
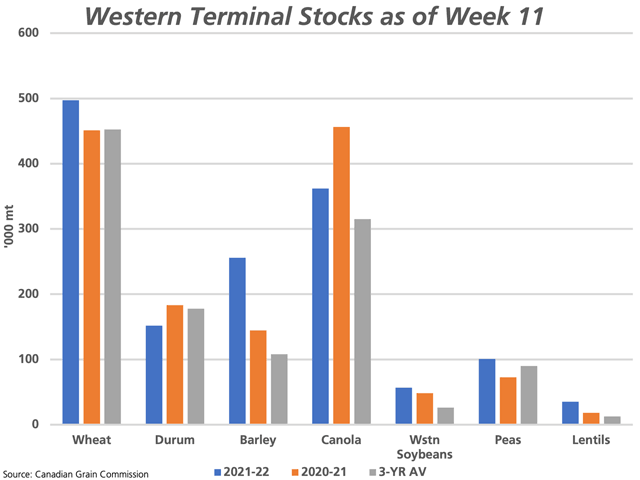
The attached chart breaks this data down further into select grains that account for the largest share of stocks. From here we can see that week 11 stocks of wheat (blue bars), barley, soybeans, peas and lentils reported for the western ports are higher than the same week in 2020-21 (brown bars) and the three-year average (2018-19 through 2020-21, grey bars). This leaves these terminals well-positioned for nearby shipments.
P[L1] D[0x0] M[300x250] OOP[F] ADUNIT[] T[]
On Wednesday, the CGC released September exports through licensed facilities, while reporting August/September exports of all principal field crops through licensed facilities down 34.4%, with exports of soybeans down 85.3%, canola down 67%, wheat down 30%, barley down 2.5% and lentils exported through bulk channels down 0.9%. Only one of the largest crops is showing a year-over-year increase in exports, with durum exports up 22.5% in the first two months of the crop year.
It is also interesting to note where stocks are located. Of the major crops shown, 67% or two-thirds of the volume is situated in West Coast export positions, which is up from 56% this time last year and the three-year average of 57%.
Watch for large shipments when the CGC releases week 12 data on Oct. 28. This week's Weekly Performance Update shows 16 vessels cleared in week 12, up sharply from seven vessels reported as cleared in week 11.
Cliff Jamieson can be reached at cliff.jamieson@dtn.com
Follow him on Twitter @Cliff Jamieson
(c) Copyright 2021 DTN, LLC. All rights reserved.


Comments
To comment, please Log In or Join our Community .