Canada Markets
Canada's Cumulative Wheat Exports as of Week 7
Watch for Agriculture and Agri-Food Canada to revise higher the forecast for wheat exports (excluding durum) by roughly 2.5 million metric tons (mmt) to 13.5 mmt this month.
AAFC's August estimate of 11 mmt was released on Aug. 20, while official estimates have been released since by Statistics Canada, including the July 31 stocks estimate and two production estimates.
July 31 stocks reported by Statistics Canada were higher than expected in pre-report estimates. At 4.954 mmt, wheat stocks as of July 31 were higher than expected, up 4% from the previous crop year. Of this volume estimated, 42% was estimated on farm, which ironically, is the same percentage calculated for 2020-21 (farm stocks to total stocks) and higher than the five-year average of 40.6%. This is despite the record exports achieved in the previous crop year. This estimate is 695,000 mt higher than AAFC's unofficial estimate released in August.
P[L1] D[0x0] M[300x250] OOP[F] ADUNIT[] T[]
In addition to higher stocks, official production estimates show wheat production (excluding durum) at 18.170 mmt, down 10.442 mmt or 36.5% from 2020-21. At the same time, this is higher than the 16.351 mmt forecast by AAFC in August.
Official data would suggest 2021-22 supplies could be revised higher by 2.514 mmt, while uncertainty may remain over the July 31 farm stocks and the harvested acre estimate. Current Statistics Canada estimates include 96.3% of the acres harvested in 2021, slightly lower than 97.9% in 2020-21 but close to equal to the five-year average of 96.4%. AAFC's unofficial estimate for August included harvested acres of 92% of estimated seeded acres. Official estimates of harvested acres will not be updated until the December Statistics Canada release.
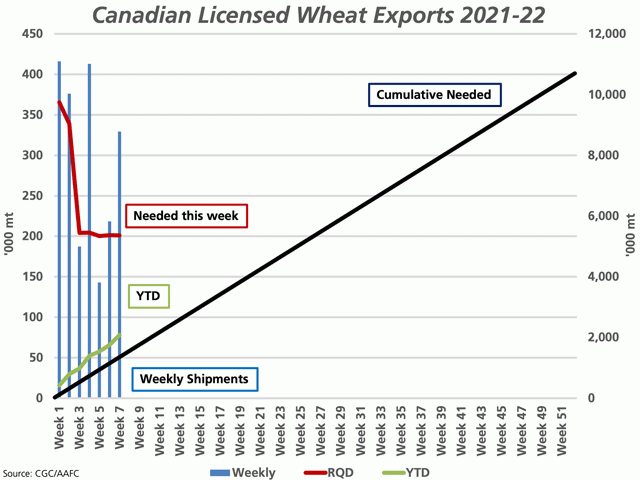
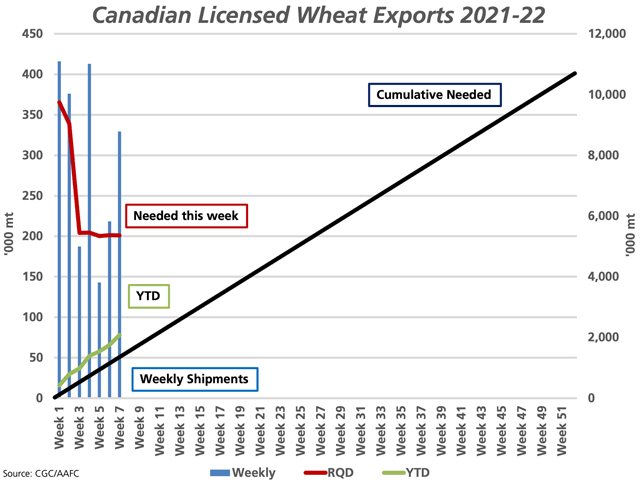
As of Week 7, or the week ended Sept. 19, cumulative wheat exports (excluding durum) are pegged at 2.0835 mmt, down 36.1% from the fast pace of movement in the previous crop year, but down only 8.7% from the five-year average. This is shown by the green line, measured against the secondary vertical axis.
This volume is ahead of the steady pace needed to reach AAFC's current 11 mmt forecast, as indicated by the upward-sloping black line, also measured against the secondary vertical axis. Should AAFC revise their forecast by 2.5 mmt higher due to the higher stocks and production estimates, as described earlier, the current pace of movement continues to exceed the steady pace needed to reach the revised 13.5 mmt forecast by 266,200 mt.
Cliff Jamieson can be reached at cliff.jamieson@dtn.com
Follow him on Twitter @Cliff Jamieson
(c) Copyright 2021 DTN, LLC. All rights reserved.


Comments
To comment, please Log In or Join our Community .