

Canada Markets
Statistics Canada Reports June Crush Numbers
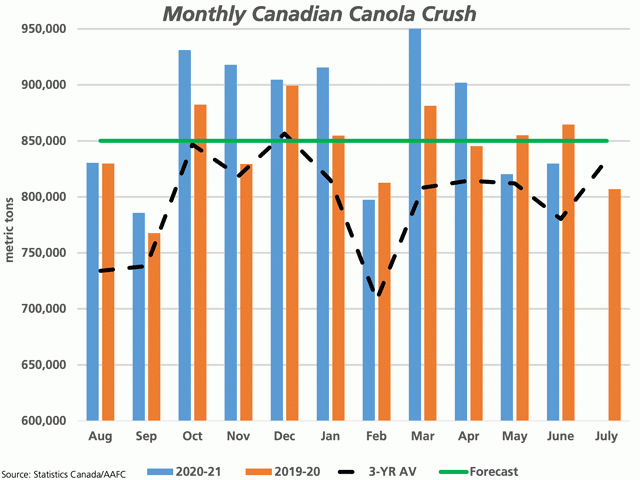
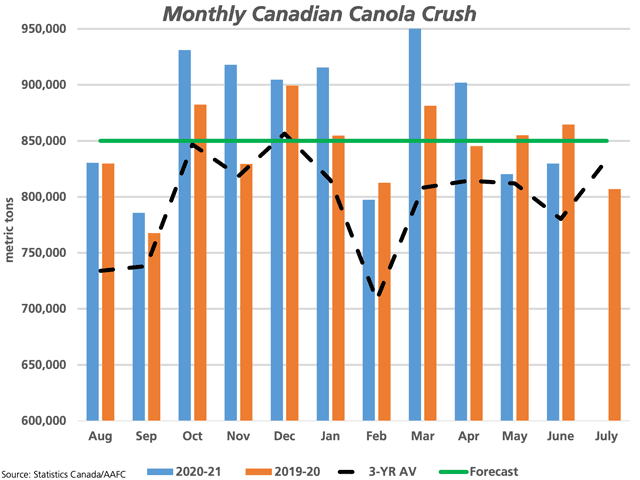
Statistics Canada reported 829,846 metric tons of canola was crushed in the month of June, up close to 9,600 mt from the month of May. While seed is being rationed and stocks are poised to fall to the lowest level seen since July 2013 according to current government forecasts, the crush activity has held up well through the 11th month of the crop year.
This volume is 4% lower than the volume crushed in the same month last year, while 6.4% higher than the three-year average for this month. It is also 2.4% below the steady pace of 850,000 mt needed each month to reach the current 10.2 mmt crush forecast, while well-above the 582,000 mt needed this month to reach the forecast due to the aggressive crush seen earlier in the crop year. Only 607,361 mt is needed in the final month of the crop year to reach the current forecast.
The cumulative pace shows 9.593 million metric tons crushed so far this year, 2.9% higher than the same period in 2019-20. It is also 2.6% higher than the steady pace needed to reach this forecast. After 11 months, this crop year's crush is already 0.3% higher than the three-year average for the entre crop year, while 3.8% higher than the five-year average.
P[L1] D[0x0] M[300x250] OOP[F] ADUNIT[] T[]
Over the first 11 months of the year, 4.166 mmt of oil has been produced, which accounts for 43.4% of the seed crushed. This compares to the 2019-20 final showing a 43.8% oil content, while below the three-year average of 44% and the five-year average of 43.8%.
The Canadian Canola Board Margin Index was reported at $35.37/mt on July 26, down $7.81/mt from the previous day. This is down from $48.06/mt reported one week earlier, the $98.03 reported one month ago and the $64.29/mt reported on this day in 2020. A ProphetX chart approximating the move of this index shows a recent June high of $188.80/mt, while the July low is seen at $8.83/mt.
Also on Tuesday, Statistics Canada released its Deliveries of major grains report for June, showing 19.459 mmt of canola delivered by producers over the first 11 months of the crop year. Current Statistics Canada estimates include a 1.836 mmt farm stocks estimate as of July 31, 2020, while production is estimated at 18.720 mmt. Current deliveries account for 94.7% of estimated stocks, which would leave approximately 1 mmt of seed to cover July exports and crush. Stocks are likely to be tighter than the current 700,000 mt forecast, while there may be more seed available than currently forecast.
This month's soybean crush was reported at 109,428 mt, up slightly from the previous month but still the second-lowest monthly volume crushed this crop year. This volume is down 10.1% from the same month last crop year and down 23% from the three-year average. This volume falls short of the steady pace of 150,000 mt/month needed to stay on track to reach AAFC's forecast of 1.8 mmt, which was left unchanged in July.
Year-to-date, 1.364 mmt has been crushed, down 7.8% from the first 10 months of the 2019-20 crop year and 15.8% lower than the three-year average for this period.
Cliff Jamieson can be reached at cliff.jamieson@dtn.com
Follow him on Twitter @Cliff Jamieson
(c) Copyright 2021 DTN, LLC. All rights reserved.
Comments
To comment, please Log In or Join our Community .