Canada Markets
Disappearance Plus Commercial Stocks as a Percentage of Crop Year Supplies
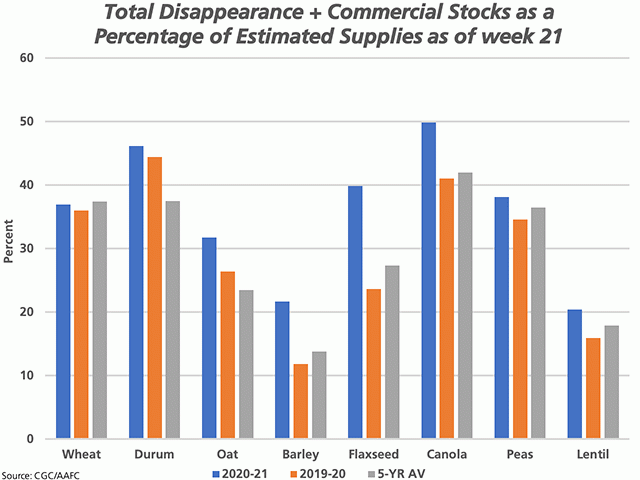
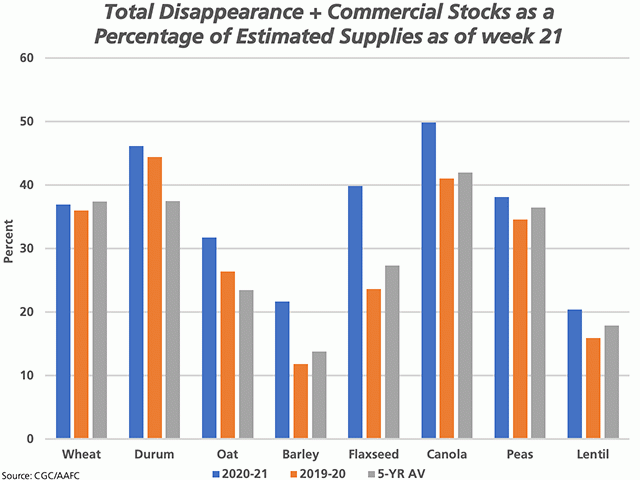
Weekly Canadian Grain Commission data, as of week 21, or the week-ending Dec. 27, shows total grain disappearance (licensed exports plus domestic use) plus commercial stocks, three known volumes, at 39.029 million metric tons, up 15.3% or 5.2 mmt from 2019-20 and 16.9% higher than the five-year average.
It is important to note that this calculation is based on data immediately after the Christmas holidays, following a time when data for two to three weeks are batched. Data for 2015-16 through 2019-20 are as of week 22, which indicates that historic data is overstated due to an extra week of activity.
The highest percentages calculated for the selected crops, as of week 21 or 40.4% of the crop year, are seen for canola at 49.9%, followed by durum at 46.1%, based on current estimates for total supplies in 2020-21. Any surprise in Dec. 31 stocks reported by Statistics Canada on Feb. 5 could lead to market volatility for many crops.
P[L1] D[0x0] M[300x250] OOP[F] ADUNIT[] T[]
Relative to past years, the calculation for flax stands out, with this calculation 16.2 points higher than 2019-20 and 12.5 points higher than average, given the pace of exports.
Also of interest, the calculation for wheat (excluding durum) is the closest to historical data. This calculation shows cumulative disappearance plus commercial stocks, as of week 21, to be just 1 point higher than 2019-20 and 0.4 points below the five-year average.
**
DTN 360 Poll
This week's poll asks how you view soybeans as a cropping choice for 2021. You can weigh in with your thoughts on this poll, which is found at the lower-right of the DTN Home Page. We thank you for sharing your ideas.
Cliff Jamieson can be reached at cliff.jamieson@dtn.com
Follow him on Twitter @CliffJamieson
(c) Copyright 2021 DTN, LLC. All rights reserved.


Comments
To comment, please Log In or Join our Community .