
Canada Markets
Saskatchewan Yield Estimate Trend
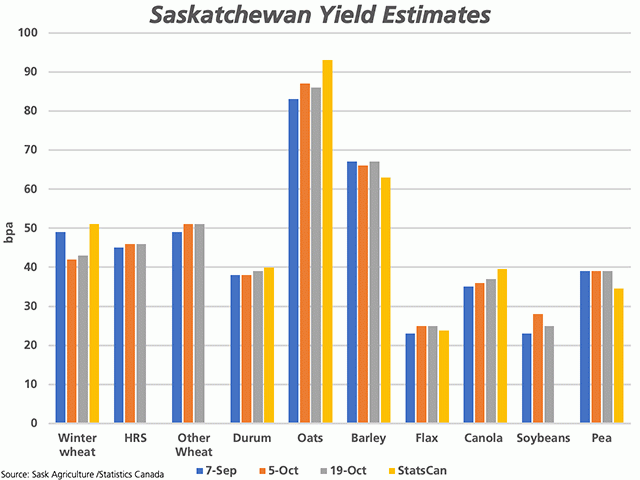
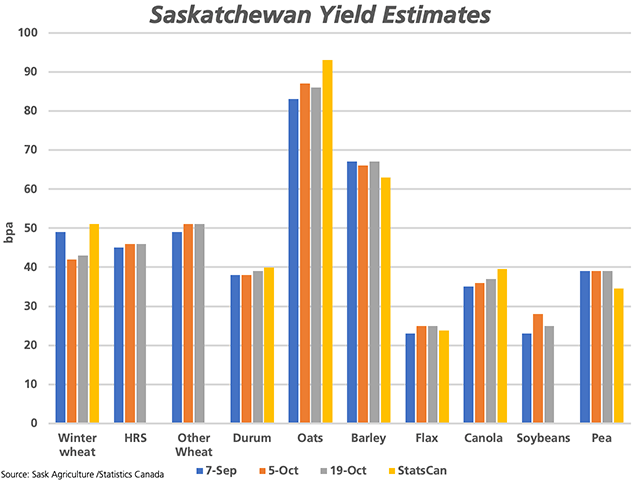
The attached chart shows the recent trend in Saskatchewan Agriculture's recent yield estimates by select crops, with the grey bar representing the final estimate released as of Oct. 19. This trend is then compared to Statistics Canada's most recent estimate, pointing out potential discrepancies ahead of the final Statistics Canada estimates scheduled for Dec. 3.
Over the course of this month and as the province's harvest moved north, the province's yield estimates for hard red spring wheat, other spring wheat varieties, flax and dry peas were left unchanged. Estimates for oats were lowered 1 bushel per acre and soybeans were lowered by 3 bpa. Not shown is lentils, also lowered by 12 pounds per acre.
At the same time, the estimate for winter wheat, durum, barley and canola were increased by 1 bpa. Not shown is canary seed, with a 25 lb./acre upward revision, along with chickpeas, revised 31 pounds higher.
When the spread is considered between the province's estimates and the official Statistics Canada's estimates (grey bar versus yellow bar), we see the largest spreads to be addressed in Statistics Canada's final estimates on Dec. 3 for winter wheat, oats, barley, canola and peas. It's also interesting to see that across these crops, provincial estimates vary from both lower and higher than the official estimates released by Statistics Canada.
P[L1] D[0x0] M[300x250] OOP[F] ADUNIT[] T[]
For example, Statistics Canada's current estimate for Saskatchewan oats shows and average yield of 93.1 bpa, which compares to the province's estimate of 86 bpa, a 7.1 bpa spread. Meanwhile the federal agency's barley yield estimate is 63 bpa, which compares to the province's 67 bpa estimate.
The spread between the province's canola estimate and the estimate from Statistics Canada continues to narrow, with Saskatchewan's 1 bpa increase, to 37 bpa, which compares to the federal governments' 39.6 bpa. While not shown, the official estimate for chickpea yield is 374 lbs./ac higher than the province's latest estimate, which could lead to a correction when final estimates are release.
Yellow bars are not shown for wheat as the province provides estimates for hard red spring and other spring wheat varieties, while Statistics Canada provides an estimate for all spring wheat. Estimating the province's spring wheat yield, assuming 92% is HRS and 8% is other varieties, would indicate that Statistics Canada's estimate is just 1 bpa higher than the province at 47.9 bpa.
**
DTN 360 Poll
This week's poll asks which crop you think has the most bullish potential in the 2020-21 crop year? You can weigh in with your ideas on this poll located on the lower-right side of your DTN Canada Home Page.
Cliff Jamieson can be reached at cliff.jamieson@dtn.com
Follow him on Twitter @Cliff Jamieson
(c) Copyright 2020 DTN, LLC. All rights reserved.
Comments
To comment, please Log In or Join our Community .