Canada Markets
Things to Watch in Canadian Dollar Trade
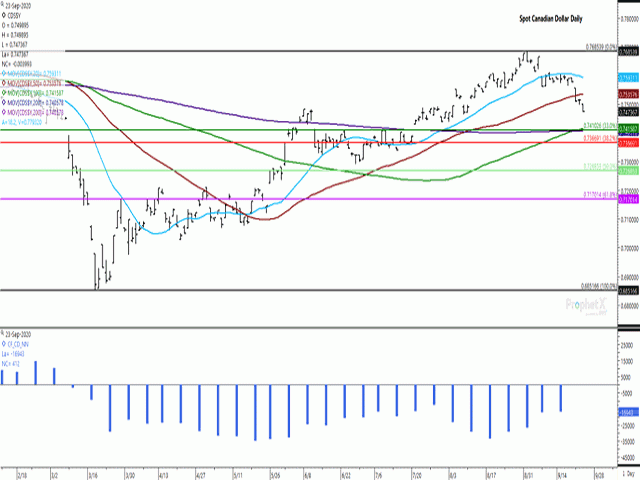
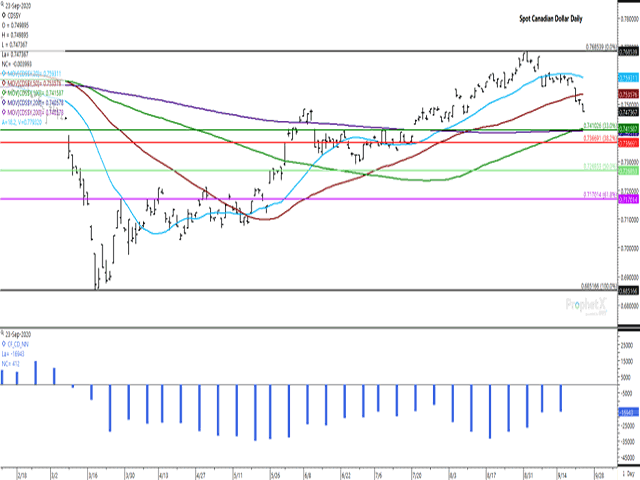
An uptrend in the Canadian dollar that started with a March 18 low of $0.6852 CAD/USD (spot dollar) ended on Sept. 1 at a high of $0.7685 CAD/USD. Wednesday's spot dollar closed at $0.7474 CAD/USD, down 40 basis points and while showing a loss of more than 1 cent, or 104 basis points, in the first three days of this week.
While drifting sideways from Sept. 8 to Sept. 18, this week's trade began with a bearish gap lower on the daily chart, while breached the support of the spot dollar's 50-day moving average for the first time since May 15 (brown line). There was also a bearish gap lower seen in Sept. 23 trade, although difficult to see on the chart.
While not shown, the weekly chart points to weekly lows reached in late July/early August lows at $0.7439 CAD/USD as potential support. Also not shown is the monthly chart, which would indicate a bearish reversal on the long-term monthly chart with a breach of this $0.7439 level and a lower close for the month. This would not reflect the most bearish of reversals as stochastic indicators on the monthly chart have yet to reach over-bought levels.
P[L1] D[0x0] M[300x250] OOP[F] ADUNIT[] T[]
The daily chart attached shows a potential floor of technical support as we approach the $0.74 level. The 33% retracement of the move from the March-September rally is found at $0.7410, indicated by the green horizontal line. The 100-day moving average is calculated at $0.7416, while the 200-day is calculated at $0.7406 CAD/USD. A breach of this region of support could lead to a further move to the 38.2% retracement found at $0.7367 CAD/USD (horizontal red line).
Thackray's 2020 Investors Guide, with a sole focus on seasonal factors for stocks and commodities points to the Aug. 20 through Sept. 25 period to be one of two periods of seasonal strength for the Canadian dollar, close to coming to an end. This is largely linked to a corresponding period of strength for crude oil over this period, while this seasonal strength for the loonie is not as strong as seen over the month of April. Over the period from 1971 through 2018, the Canadian dollar has gained strength against the USD 32 times of the 48 years over this period in Aug/Sept, averaging a 0.2% gain overall. This is followed by an average 0.2% loss in October, a 0.5% loss in November, and a 0.1% loss in December.
The monthly chart for the spot Canadian dollar shows consecutive gains realized in September over the past four years (2016 through 2019), while averaging a modest 9 basis point increase over the past five years and an average of 26.8 basis point loss for the month over 10 years.
It is interesting to note that the blue bars of the histogram on the lower study shows investors paring their bearish net-short position in Canadian dollar futures for the fourth consecutive week in the week-ending Sept. 15, although the latest week's data shows the smallest decline over this period of just 412 contracts week-over-week. This trend has perhaps come to an end and this week's data as of Sept. 22 could show this group adding to their short positions.
Currency traders will be watching the Sept. 23 Speech from the Throne for signals of what lies ahead for the Canadian economy. The country's 2020-21 budget is already signaling a historic $342.2 billion deficit, while concerns are growing that today's speech will involve significant deficit spending as the government addresses its environmental and social programs. It is highly likely that today's speech will quickly gain the attention of the ratings agencies, who have been flashing warnings over recent months.
Cliff Jamieson can be reached at cliff.jamieson@dtn.com
Follow him on Twitter @Cliff Jamieson
© (c) Copyright 2020 DTN, LLC. All rights reserved.


Comments
To comment, please Log In or Join our Community .