Canada Markets
Dec. Spring Wheat Sends Mixed Technical Signals
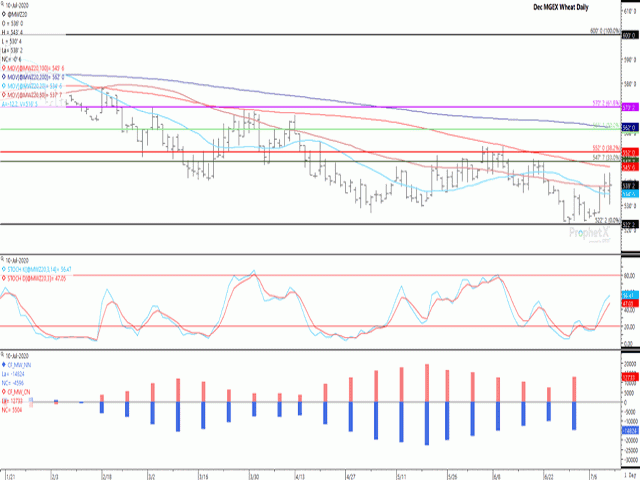
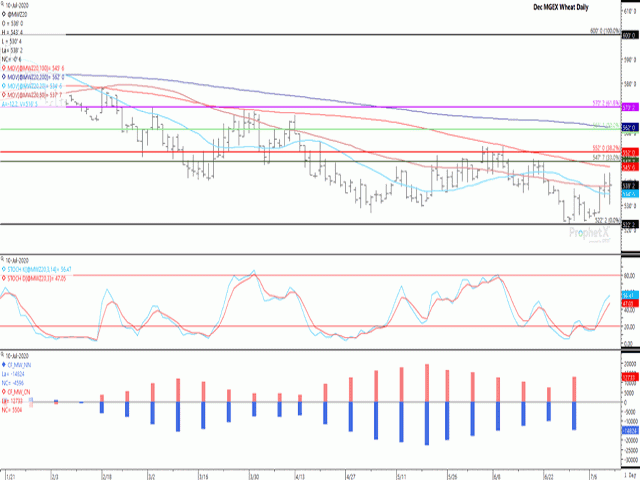
The December MGEX spring wheat contract ended lower for the first time in five sessions on Friday, down 3/4 cents to $5.38 1/4 per bushel (bu). Friday's session produced a bearish outside bar on the daily chart, trading both higher and lower than Thursday's trading range, while ending lower on the day.
This could be viewed as a sign of a reversal, although would not be the most bearish of turns, which is reserved for a change in direction when stochastic indicators cross and change direction when in oversold or overbought territory on the chart. As seen in the first study, the current indicators remain in neutral territory.
Friday's session saw price test support of both the 20-day (blue line) and 50-day (red line) moving averages, while late-session buying interest saw a boost in price that led to a close above both moving averages for a second straight session.
P[L1] D[0x0] M[300x250] OOP[F] ADUNIT[] T[]
Should buying interest return next week, nearby resistance may be seen at the contract's 100-day moving average at $5.45 3/4/bu, while the 33% retracement of the June downtrend is seen at $5.48/bu.
A different perspective is seen on the weekly chart (not shown), with the December contract gaining 14 1/2 cents this week, a second weekly increase, while momentum indicators are showing a crossover near the lower end of the neutral region of the chart. This particular crossover is not viewed as the most bullish of turns as it is not taking place within oversold territory. A similar crossover was seen on the weekly chart in mid-March that resulted in a one-week rally that saw a gain of 13 1/4 cents that was followed by weekly losses in four of the next five weeks.
While not seen on the attached chart, updated CFTC data as of July 7 shows noncommercial traders cautiously adding to their bearish net short futures position for a second week, increasing by 220 contracts to 15,044 contracts, as seen on the blue bars of the histogram on the lower study. This is the largest bearish position held in four weeks.
The red bars of the histogram show commercial traders continuing to hold a net-long position as of the same date, increasing this position for a second week to 13,416 contracts, the largest seen in five weeks.
Cliff Jamieson can be reached at cliff.jamieson@dtn.com
Follow him on Twitter @Cliff Jamieson
© (c) Copyright 2020 DTN, LLC. All rights reserved.


Comments
To comment, please Log In or Join our Community .