

Canada Markets
A Look at USDA's Growing Global Wheat Stocks Estimates
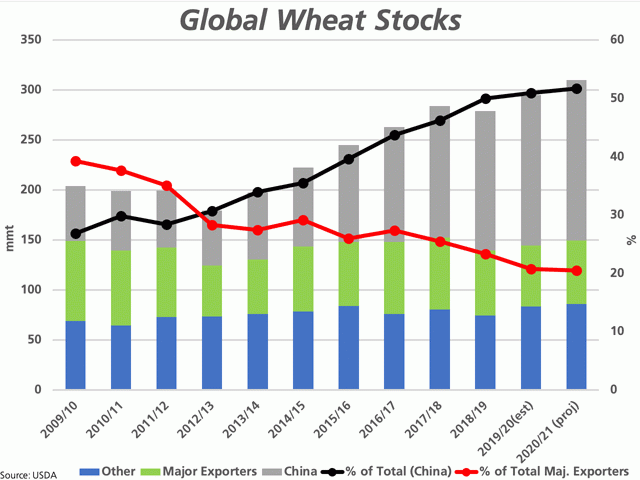
As seen on the attached chart, global wheat stocks first surpassed the 200 million metric ton (mmt) level in 2009-10, estimated at 204.1 mmt. Global stocks then dipped below the 200 mmt level for four crop years, then have held consistently above this level since 2014-15.
The May 12 USDA report includes not only the first estimates for the 2020-21 crop year, but also the first estimate of global stocks exceeding the 300 mmt level, with a projection of global stocks of 310.12 mmt, up 15 mmt or 5.1% from 2018-19 and would be the seventh increase in eight years.
What is interesting in this data is that in 2009-10, global stocks excluding estimated stocks for China, are shown at 149.2 mmt, while 11 years later, the estimate for global stocks (excluding China) is 149.8 mmt, just 600,000 metric tons (mt) higher. Global stocks, excluding China's stocks, have ranged from 124.5 mmt to as high as 152.9 mmt over this period. The bars on the attached graphic highlight the bearish growth in total stocks, including China's stocks (grey), stocks of the eight major exporters (green) and stocks from the rest of the world (blue), with the 310 mmt representing a bearish 41.2% of global use. Take away the growth in China's stocks, wheat stocks have been somewhat flat.
P[L1] D[0x0] M[300x250] OOP[F] ADUNIT[] T[]
The black line with markers highlights the growth in China's stocks as a percentage of total world stocks, with this months' report estimating that 160.36 mmt forecast stocks in China for 2020-21 representing 51.7% of the total, which would be the highest percentage reached.
The opposite trend is seen in the red line with markers that represent the percentage of stocks held by the world's eight major exporters (Argentina, Australia, Canada, European Union, United States, Russia, Ukraine and Kazakhstan). This percentage is forecast to fall for the fourth straight year to 20.5% in 2020-21.
Production forecasts show production within this group of eight countries will grow by close to 3 mmt year-over-year, with the largest changes including a significant recovery of 8.8 mmt in Australia offset by an expected decline of close to 12 mmt in the E.U. This is close to the 4.17 mmt increase forecast for global production in 2020.
While the global data will be viewed as bearish overall by the markets, these are early days and changes ahead can be counted on.
DTN 360 Poll
This week's DTN 360 Poll asks what you think will be the most likely revision we will see in the seeded-acre estimates released by Statistics Canada due to the challenges faced in surveying for the March Intentions report? This poll is found at the lower right of your DTN Canada Home Page. We thank you for sharing your opinions!
Cliff Jamieson can be reached at cliff.jamieson@dtn.com
Follow him on Twitter @Cliff Jamieson
© (c) Copyright 2020 DTN, LLC. All rights reserved.

Comments
To comment, please Log In or Join our Community .