

Ag Weather Forum
Updated USDA Plant Hardiness Zone Map Shows Climate Change Influence
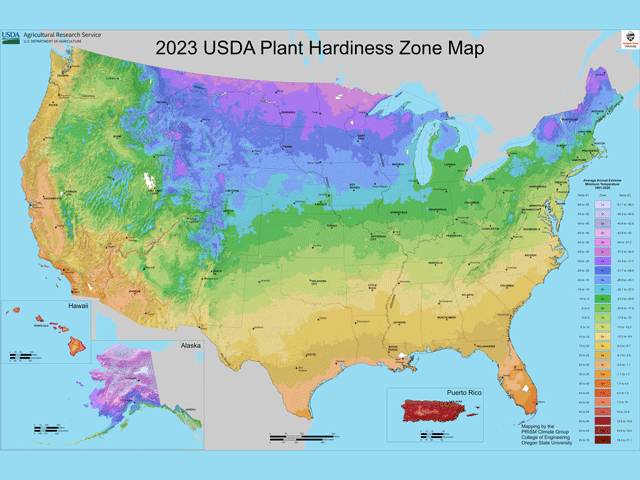
For the first time in more than 10 years, an updated Plant Hardiness Zone Map (PHZM) has been published by USDA in collaboration with the PRISM Climate Group at Oregon State University. The map uses weather data from 1991-2020 and, as with earlier versions, is divided into 13 climate zones across the United States.
The map is described by USDA as "the standard by which gardeners and growers can determine which perennial plants are most likely to thrive at a location. The map is based on the average annual extreme minimum winter temperature, displayed as 10-degree Fahrenheit zones and 5-degree F half zones." Data from a total of 13,625 stations were used in the creation of the map, a much more detailed set of information than in previous editions.
P[L1] D[0x0] M[300x250] OOP[F] ADUNIT[] T[]
The Plant Hardiness Zone Map was last updated in 2012. Since then, temperatures have warmed significantly. Chris Daly, the director of the Oregon State PRISM Climate Group, told National Public Radio that the new
Map is about 2.5 degrees Fahrenheit higher than the 2012 map across the contiguous U.S. Daly also told the New York Times that Arkansas, Kentucky, Missouri and Tennessee had the biggest changes, as much as five degrees Fahrenheit warmer than the 2012 map.
On average, the 2023 Plant Hardiness Zone Map shows a one-quarter climate zone shift to the north. But many states in the interior U.S. had a half-zone migration northward. Commenting on the Plant Hardiness Zone Map update, Illinois State Climatologist Trent Ford noted that climatological winter seasons (December-January-February) have warmed "faster than any other season over the past century. In the winter, though, nighttime low temperatures have increased at a faster rate than daytime high temperatures." This rate of warming is likely reflected in the half-zone plant hardiness move northward in the central U.S. In general, the year 2023 is on track to be the hottest year measured in human history.
The Plant Hardiness Zone Map will get much reference for gardening and landscaping. However, the USDA Risk Management Agency also uses the plant hardiness zone designations in establishing certain standards for crop insurance. Crop production is also served by the updated plant hardiness zone detail when it comes to research on weeds, insects and diseases. The plant hardiness zones become a data layer in research models and thus are useful for scientists in understanding the potential impact of climatic conditions on the distribution of species.
The 2023 Plant Hardiness Zone Map and additional graphics are available here: https://planthardiness.ars.usda.gov/…. Canada produces its own plant hardiness map which is available here: http://planthardiness.gc.ca/….
Bryce Anderson can be reached at Bryce.Anderson@dtn.com
(c) Copyright 2023 DTN, LLC. All rights reserved.

Comments
To comment, please Log In or Join our Community .