

Technically Speaking
Dr. Technical Talks the USDX
A few weeks ago, my On the Market column was titled "Dr. Technical and Mr. Supply". This piece talked about the two parts of my analytical self that don’t, haven't, gotten along for quite some time. Mean ol' Mr. Supply looks at nothing but supply and demand (you can read his latest thoughts in the latest Market Matters blog on DTN). While Dr. Technical remains a quiet observer of market trend, and a corn market bull. However, the latter has been shaken following the recent U.S. presidential election.
Mr. Supply is correct in saying that U.S. corn farmers produced another record crop. The previous three years saw the three largest crops on record, leading to an increase of 6.5 million acres (ma) planted and an increase of 7.3 ma harvested (according to USDA's November Crop Production report) in 2016. And yes all of this increased production did supposedly result in ending stocks of about 2.4 billion bushels, the highest in modern times, putting the latest ending stocks-to-use projection at 16.4%. You can read all about this in Mr. Supply's blog post.
Despite these overwhelming numbers, I was still bullish corn until early a week ago today when the results of the 2016 U.S. presidential election were finalized. Whether one be happy or sad of the result, as far as the corn market, and commodities in general, it looks to be bearish. Why? Because the President-elect wants higher interest rates and to rewrite standing trade agreements with key buyers of U.S. grains.
P[L1] D[0x0] M[300x250] OOP[F] ADUNIT[] T[]
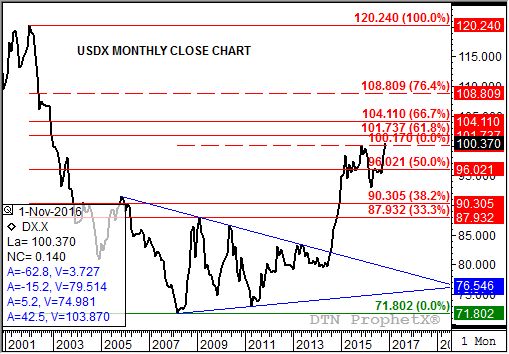
Remember, I'm a market technician looking at price patterns, nothing more. I'll leave the political analysis to others at DTN. But what I see on the monthly close chart for the U.S. dollar index (USDX) is concerning, particularly for those with a stake in the continued production of record crops and burdensome supplies needing interested buyers.
Why the monthly close only chart for the USDX? Two reasons: First, it's my opinion that long-term charts give us a better picture of long-term trends. Simple enough. Our view can get too cluttered looking at the constant changes in direction of daily, and even weekly, charts. Second, I chose the close only because from a chartist's, not a trader's mind you, point of view the most important price is the close. Connecting those closing prices gives us the long-term trend that reflects the long-term opinion of a market.
In regards to the USDX, that trend is looking like a bullish breakout that could take it much, much higher.
Notice that the USDX is priced at 100.370 Wednesday morning. This is above the previous high monthly close of 100.170 from November 2015. If the USDX closes above this level at the end of the month, the previous downtrend turned sideways trend becomes an uptrend. As for the next upside target, add the range of roughly 7.09 from last November's high through this past April's low of 93.082 to the breakout point (100.170). The resulting target is 107.26, or a test of the 76.4% retracement level of the previous major (long-term) downtrend from 120.240 through the low of 71.802.
If, by chance, the USDX rockets to the 107.00 to 108.00 area, it would be at its highest level since June 2002. My research shows that the Fed Fund rate at that time was 1 3/4%, as compared to the Federal Reserve's vague 0.25% to 0.50% heading into an almost guaranteed December rate increase. A move that looks to be the first of many over the coming year.
Therefore, it seems technically logical to expect the Fed Fund rate to be increased by more than 1% sooner rather than later, providing the fundamentals for the USDX to reach the mid-2002 levels indicated by its long-term chart. And here's an interesting note, again referring back to Mr. Supply's blog, the last time U.S. corn ending stocks to use was this high was the 2001-2002 marketing year (running from September 2001 through August 2002 and including, obviously, June 2002) with a 16.3%. And as Mr. Supply so gleefully pointed out, cash corn reportedly average $1.97 that marketing year.
So yes, my bullishness towards commodities in general, including corn, is not as strong as it was prior to the election. From a chart point of view I was likely focusing on too short of a timeframe, though I've seen this pattern building on the expanded monthly close only chart for a number of years. The USDX needed a reason to breakout, and it seems to have it now. Let's see how the month closes before we make any long lasting conclusions.
To track my thoughts on the markets throughout the day, follow me on Twitter: www.twitter.com\DarinNewsom

Comments
To comment, please Log In or Join our Community .