
Technically Speaking
Nov Beans: Gravity, Bungees, Three Days, and Waves
Generally speaking, markets tend to take a long time to rally as buying interest continually has to push against gravity. And that same gravity, usually, leads to a market quickly erasing gains that took days, weeks, or months to accumulate. A recent example is what happened in corn last week. Over the span of 5 days the December contract erased all but 18 1/2 cents of an 85 cent rally that took two-and-a-half months to build.
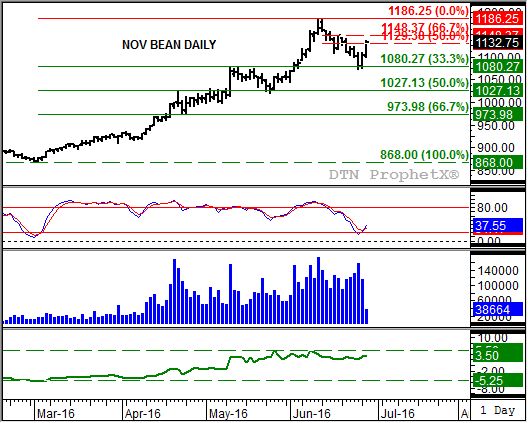
November soybeans (SX6) are another example of market gravity at work. A look at its daily chart shows the contract posted a high of $11.86 1/4 on June 13. From there SX6 fell to a low of $10.72 1/2 on June 24. This $1.13 3/4 sell-off over the span of 10 days, retracing 33% of the previous uptrend that had lasted from the March 2 low of $8.68.
P[L1] D[0x0] M[300x250] OOP[F] ADUNIT[] T[]
However, look at what happened after the contract closed near its low last Friday. The combined gains of Monday and the overnight session have quickly retraced 50% of the June sell-off. The question now is whether this is nothing more than a bungee-like reaction or an actual bullish turn on the daily chart.
Technical indicators would suggest this is nothing more than a bungee bounce. Daily stochastics (second study) show SX6 didn't fall back enough to create an oversold situation below 20%. Recall from previous posts that trends have a better chance of a lasting turn if a bullish crossover (faster moving blue line crosses the slower moving red line) below the oversold level of 20% (bullish) or above the overbought level of 80% (bearish). The fact a crossover looks to be occurring above 20% indicates this may be a temporary bounce, possibly lasting three days, against the minor (short-term) downtrend that remains in place.
Take a moment to think what a three-day move against the trend means in soybeans this week. After being pummeled, SX6 rallies as noncommercial selling takes a breather and light commercial buying steps in. For the latter, note the continued strength of the November-to-January futures spread (bottom study) as its inverse of 3 1/2 cents is near the recent high of 5 1/2 cents (top dashed green line).
However, it’s the lack of noncommercial support that could lead to another sell-off by SX6. Note that trade volume (third study, blue histogram) has declined this week as the contract posts its rally. This is generally viewed as technically bearish, indicating buying interest is much lighter than the selling interest that pushed the market lower. And the group most likely to be showing less interest is the noncommercial side.
Again, a three-day contra-trend move would take SX6 through Wednesday's close, just ahead of Thursday's June 30 USDA Quarterly Stocks and Acreage reports. This would imply that new-crop soybeans could see a bearish reaction to the numbers, putting a peak on Wave B (Elliott Wave Theory) possibly near the 67% retracement point of $11.48 1/2, and sending the contract into Wave C of its minor 3-Wave downtrend with the next downside target near $10.27.
To track my thoughts on the markets throughout the day, follow me on Twitter: www.twitter.com\DarinNewsom

Comments
To comment, please Log In or Join our Community .