

Technically Speaking
Monthly Analysis: Grain Markets

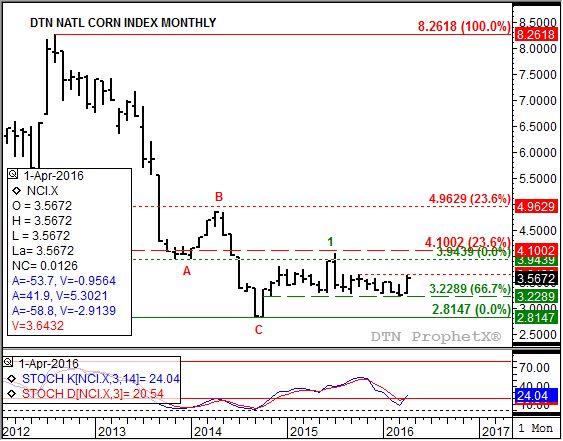
Corn (Cash): The DTN National Corn Index (NCI.X, national average cash price) closed at $3.56 3/4, up 32 3/4 cents for the month. The major (long-term) trend remains sideways with resistance at the high from October 2015 near $3.64 1/4. A move through this price would restart the market's major uptrend dating back to October 2014, and establish an upside target of $4.05 3/4. This would be a test of both the July 2015 high of $4.05 3/4 and $4.10, the 23.6% retracement level of the previous major downtrend from near $8.26 1/4 (August 2012) through the October 2014 low near $2.81 1/4.
Corn (Futures): The July contract closed at $3.91 3/4, up 40 1/4 cents on the monthly chart. The market resumed its major (long-term) uptrend that dates back to October 2014 as the most active futures contract posted a bullish outside range during April (traded below the March low, above the Mach high, and closed higher for the month). Initial resistance remains at $4.43 1/2, a price that marks the 23.6% retracement level of the previous major downtrend from $8.49 (August 2012) through the October 2014 low of $3.18 1/4.
P[L1] D[0x0] M[300x250] OOP[F] ADUNIT[] T[]
Soybeans (Cash): The DTN National Soybean Index (NSI.X, national average cash price) closed at $9.56 3/4, up $1.04 for the month. The major (long-term) uptrend strengthened during April with the NSI.X finishing at its monthly high. Initial resistance remains near $10.27 1/2, a price that marks the 23.6% retracement level of the previous major downtrend from $17.47 3/4 (August 2012) through the low near $8.05 (March 2016).
Soybeans (Futures): The July contract closed at $10.29 3/4, up $1.19 on the monthly chart. The major (long-term) trend is up with the July futures contract testing initial resistance near $10.67 1/4. This price marks the 23.6% retracement level of the previous downtrend from $17.89 (September 2012) through the low of $8.44 1/4 (November 2015). Monthly stochastics remain bullish, indicating support from both noncommercial and commercial buying could continue to be seen.
Wheat (Cash): The DTN National SRW Wheat Index (SR.X, national average cash price) closed at $4.39 1/4, up 6 1/2 cents for the month. The SR.X posted a bullish outside range in April (below the March low, above the March high, and closed higher for the month) establishing a major (long-term) uptrend. This confirms the bullish crossover by monthly stochastics seen at the end of March.
SRW Wheat (Futures): The July Chicago contract closed at $4.88 1/2, up 15 cents on the monthly chart. The major (long-term) trend is now up as more active July contract posted a new 4-month high of $5.18 1/2 during April. Next resistance is the 12-month high of $6.17 1/2 from June 2015. Monthly stochastics remain bullish after a crossover below the oversold level of 20% at the end of March.
To track my thoughts on the markets throughout the day, follow me on Twitter: www.twitter.com\DarinNewsom
Comments
To comment, please Log In or Join our Community .