

Technically Speaking
DTN National Soybean Index: Gap Happy
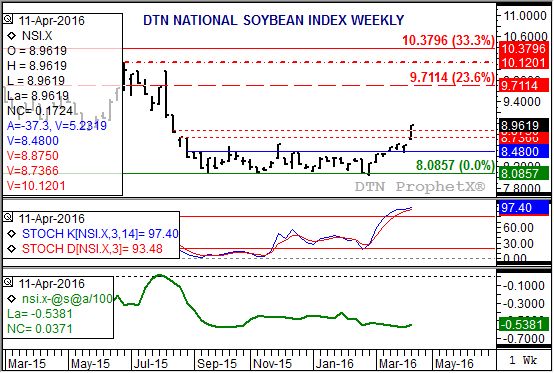
Most of you have probably noticed that the soybean market has posted a strong rally of late. Dating back to March 2, the nearby May futures contract has rallied from a low of $8.56 to this past Wednesday night's high of $9.59 1/2 for a gain of $1.03 1/2. Similarly the DTN National Soybean Index (NSI.X, national average cash price) has moved from its March 1 low of $8.06 1/4 to Wednesday's calculated $8.96 1/4, a gain of 90 cents. Despite the obvious weakening of basis (roughly 13 1/2 cents), the NSI.X has posted an impressive rally over the last month.
Wednesday's solid gain, the NSI.X jumped 17 cents from Tuesday, closed a bearish gap on cash soybeans' weekly chart that has been in place since last August. The week of August 17 saw the NSI.X post a low of $8.83 3/4, with the high the next week only $8.73 3/4. This bearish gap, with weekly stochastics already below the oversold level of 20%, led to a lengthy sideways-to-down consolidation phase culminating in the early March low.
Now that the NSI.X has closed that old bearish gap, an exhaustion gap, the market continues to grow stronger on its long-term monthly chart (see the Technically Speaking post from April 1 for a discussion of major trends). But also note that this week has seen the NSI.X leave a bullish gap, a breakaway gap, between last week's high of $8.59 1/4 and this week's low of $8.70 3/4. This would indicate that the secondary (intermediate-term) uptrend should continue to strengthen as well.
However, there is one technical feature that isn't quite as bullish. Take a look at weekly stochastics (middle study) and you'll see the NSI.X is already in an overbought situation (stochastics above the 80% level). This would indicate that cash soybeans could be due for a pullback, though not enough to change the major uptrend on the monthly chart. If so, the newly established breakaway gap could soon be filled, with technical support roughly calculated at the series of old highs near $8.48 (blue horizontal line, top chart).
To track my thoughts on the markets throughout the day, follow me on Twitter:www.twitter.com\Darin Newsom
P[L1] D[0x0] M[300x250] OOP[F] ADUNIT[] T[]

Comments
To comment, please Log In or Join our Community .